 3
3peptides
spectra
0.000 | 0.039
0.000 | 0.000
0.000 | 0.034
0.000 | 0.000
0.000 | 0.021
0.000 | 0.011
0.930 | 0.981
0.000 | 0.023
1peptide
spectra
NA | NA
NA | NA
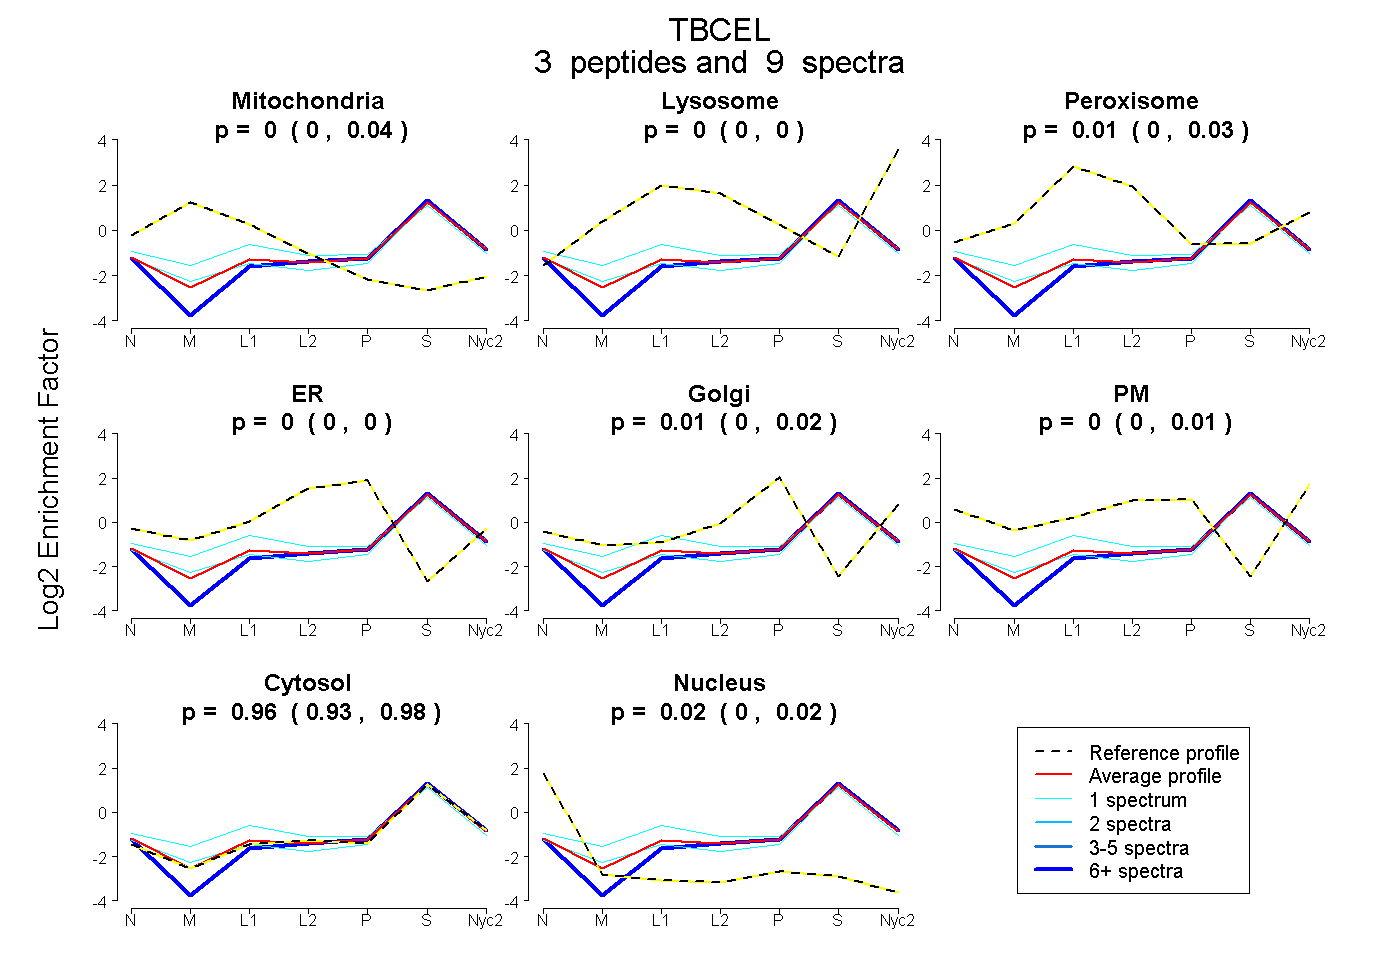
| Plot | Mito | Lyso | Perox | ER | Golgi | PM | Cytosol | Nucleus | |||||
| Expt A |
3 peptides |
9 spectra |
|
0.000 0.000 | 0.039 |
0.000 0.000 | 0.000 |
0.013 0.000 | 0.034 |
0.000 0.000 | 0.000 |
0.009 0.000 | 0.021 |
0.000 0.000 | 0.011 |
0.963 0.930 | 0.981 |
0.015 0.000 | 0.023 |
||
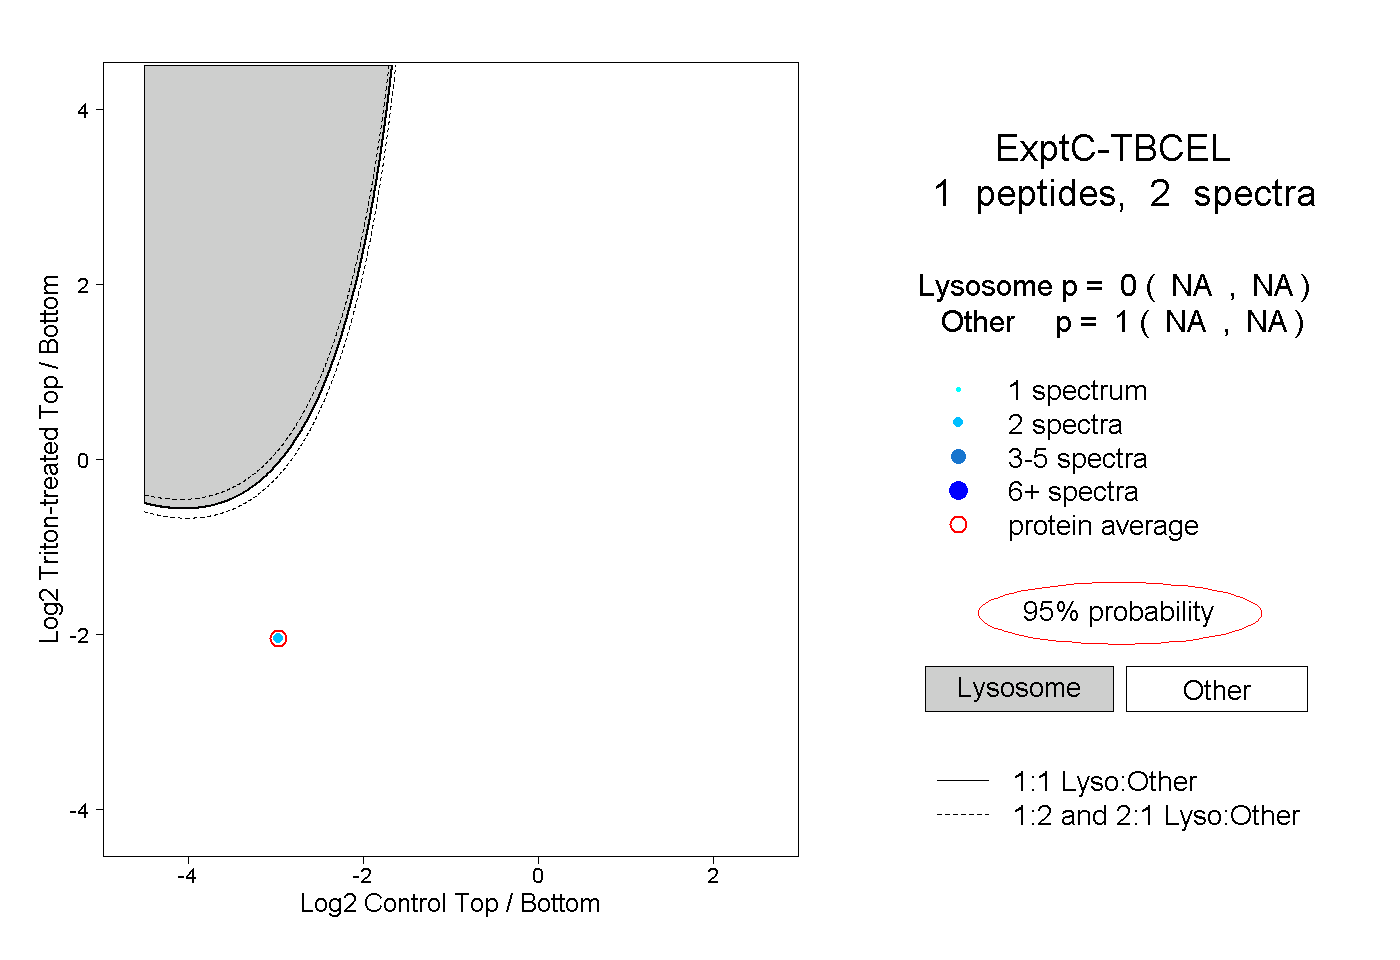
| Plot | Lyso | Other | |||||||||||
| Expt C |
1 peptide |
2 spectra |
|
0.000 NA | NA |
1.000 NA | NA |