 6
6peptides
spectra
0.000 | 0.000
0.000 | 0.000
0.000 | 0.000
0.112 | 0.139
0.000 | 0.000
0.000 | 0.000
0.478 | 0.504
0.363 | 0.397
1peptide
spectra
NA | NA
NA | NA
NA | NA
NA | NA
NA | NA
NA | NA
NA | NA
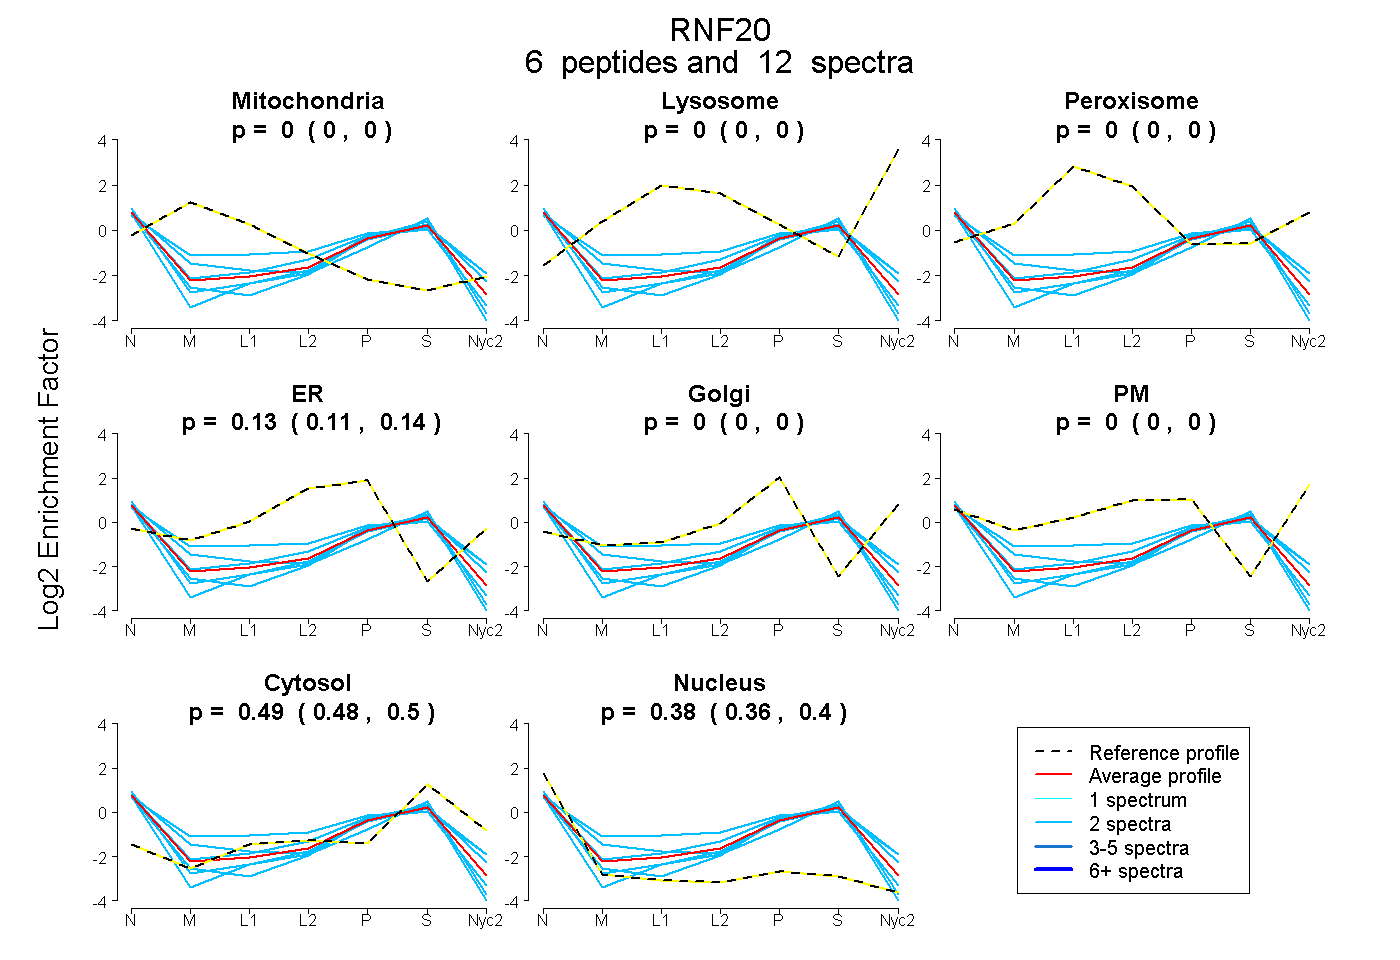
| Plot | Mito | Lyso | Perox | ER | Golgi | PM | Cytosol | Nucleus | |||||
| Expt A |
6 peptides |
12 spectra |
|
0.000 0.000 | 0.000 |
0.000 0.000 | 0.000 |
0.000 0.000 | 0.000 |
0.127 0.112 | 0.139 |
0.000 0.000 | 0.000 |
0.000 0.000 | 0.000 |
0.492 0.478 | 0.504 |
0.381 0.363 | 0.397 |
||
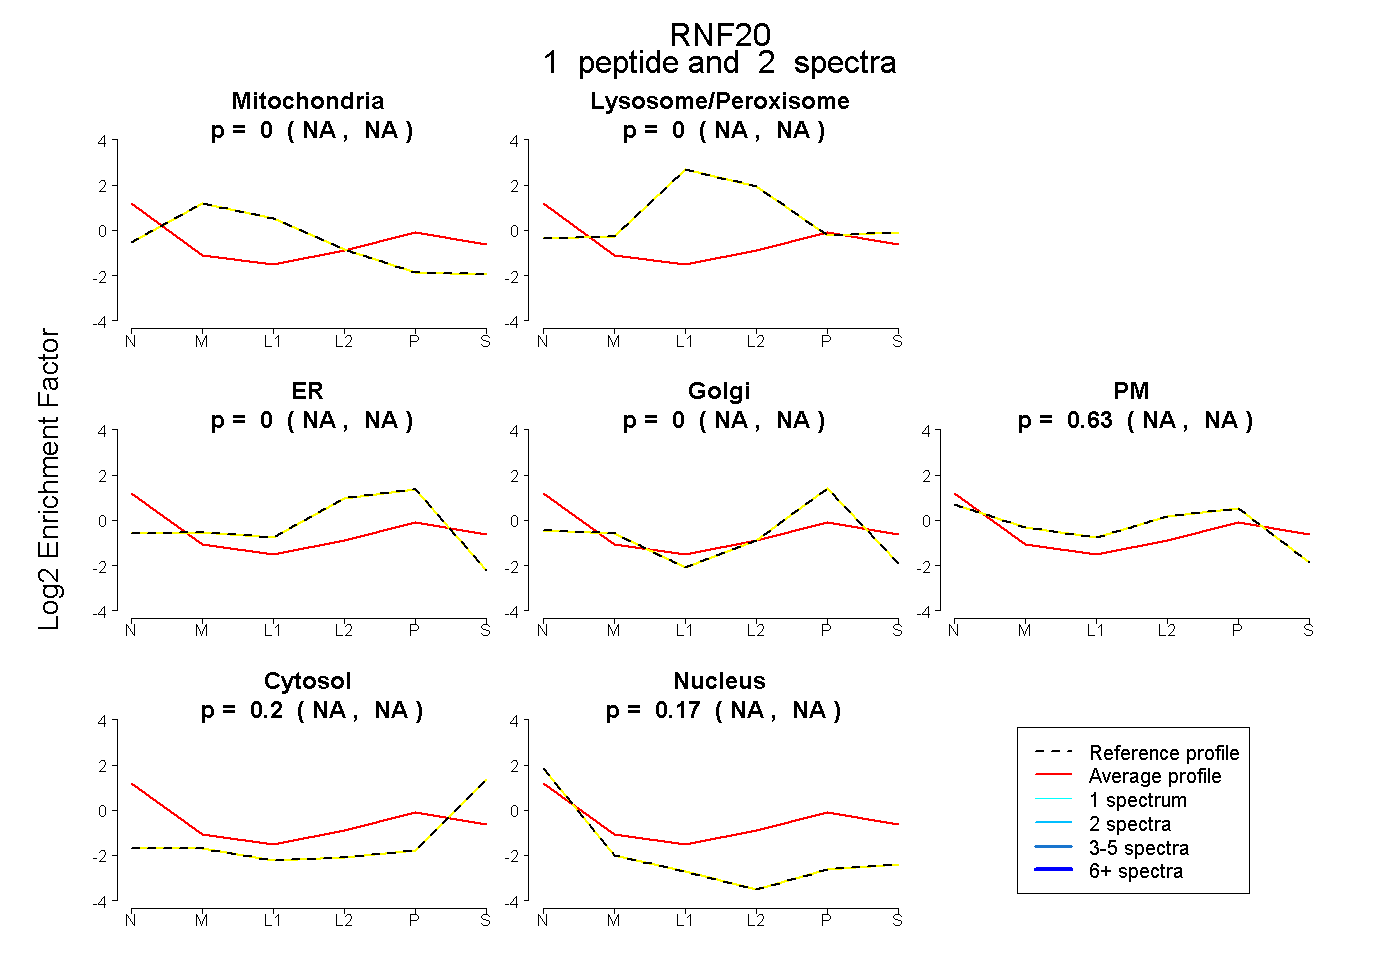
| Plot | Mito | Lyso or Perox | ER | Golgi | PM | Cytosol | Nucleus | ||||||
| Expt B |
1 peptide |
2 spectra |
|
0.000 NA | NA |
0.000 NA | NA |
0.000 NA | NA |
0.000 NA | NA |
0.633 NA | NA |
0.200 NA | NA |
0.167 NA | NA |