ARHGEF12
[ENSRNOP00000056613]
Main page
| | | Plot |
Mito |
Lyso |
|
Perox |
ER |
Golgi |
PM |
Cytosol |
Nucleus |
|
| Expt A |
 19
19
peptides |
34
spectra |
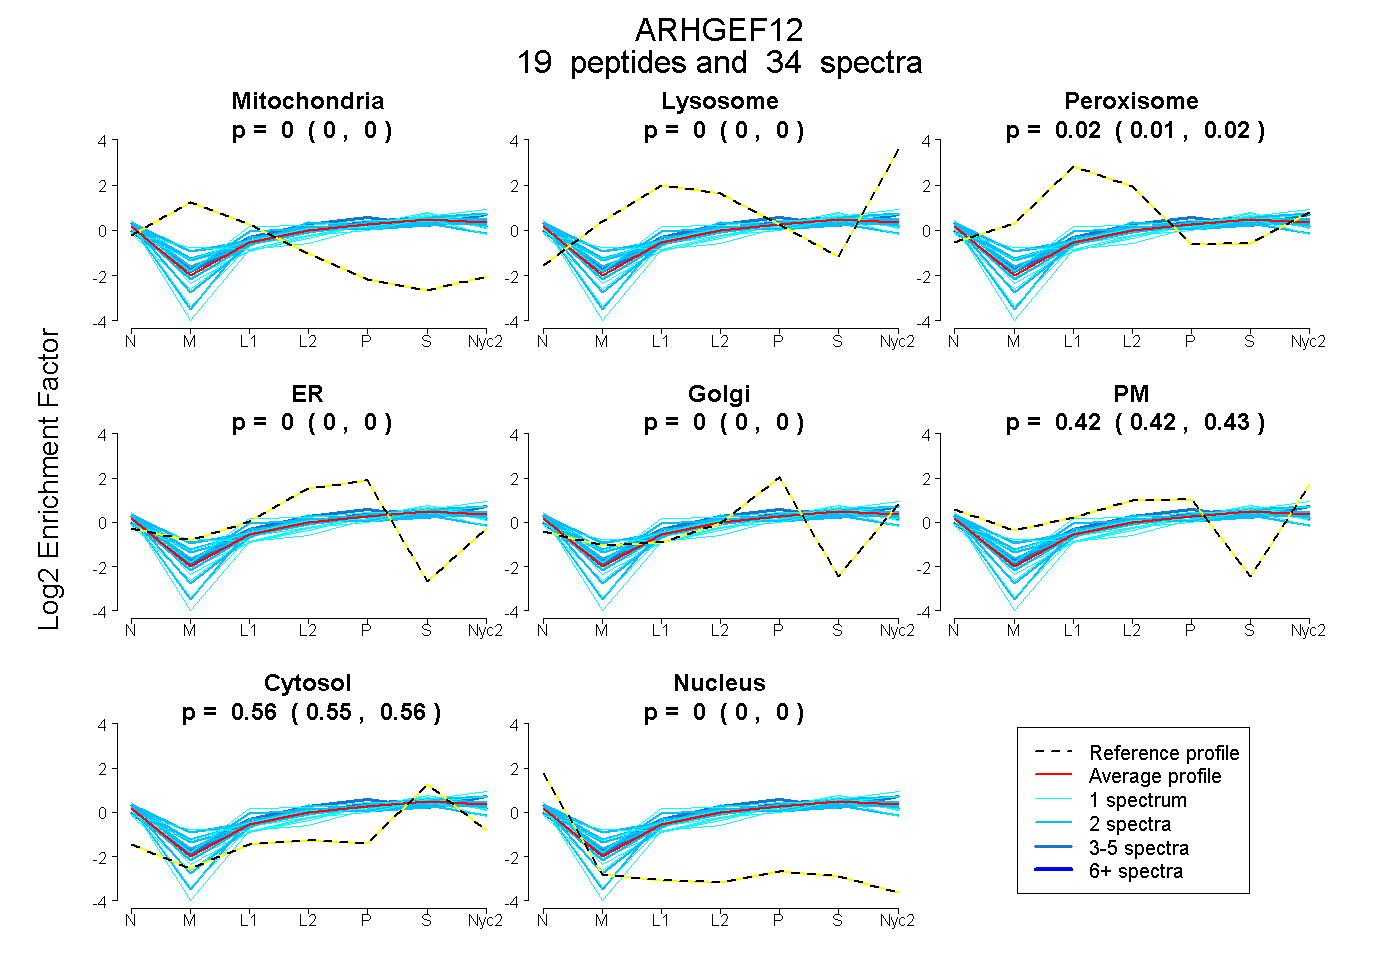 |
0.000
0.000 | 0.000 |
0.000
0.000 | 0.000 |
|
0.016
0.010 | 0.022 |
0.000
0.000 | 0.000 |
0.000
0.000 | 0.000 |
0.424
0.421 | 0.428 |
0.559
0.554 | 0.564 |
0.000
0.000 | 0.000 |
|
| | | Plot |
Mito |
|
Lyso or Perox |
|
ER |
Golgi |
PM |
Cytosol |
Nucleus |
|
| Expt B |
6
peptides |
6
spectra |
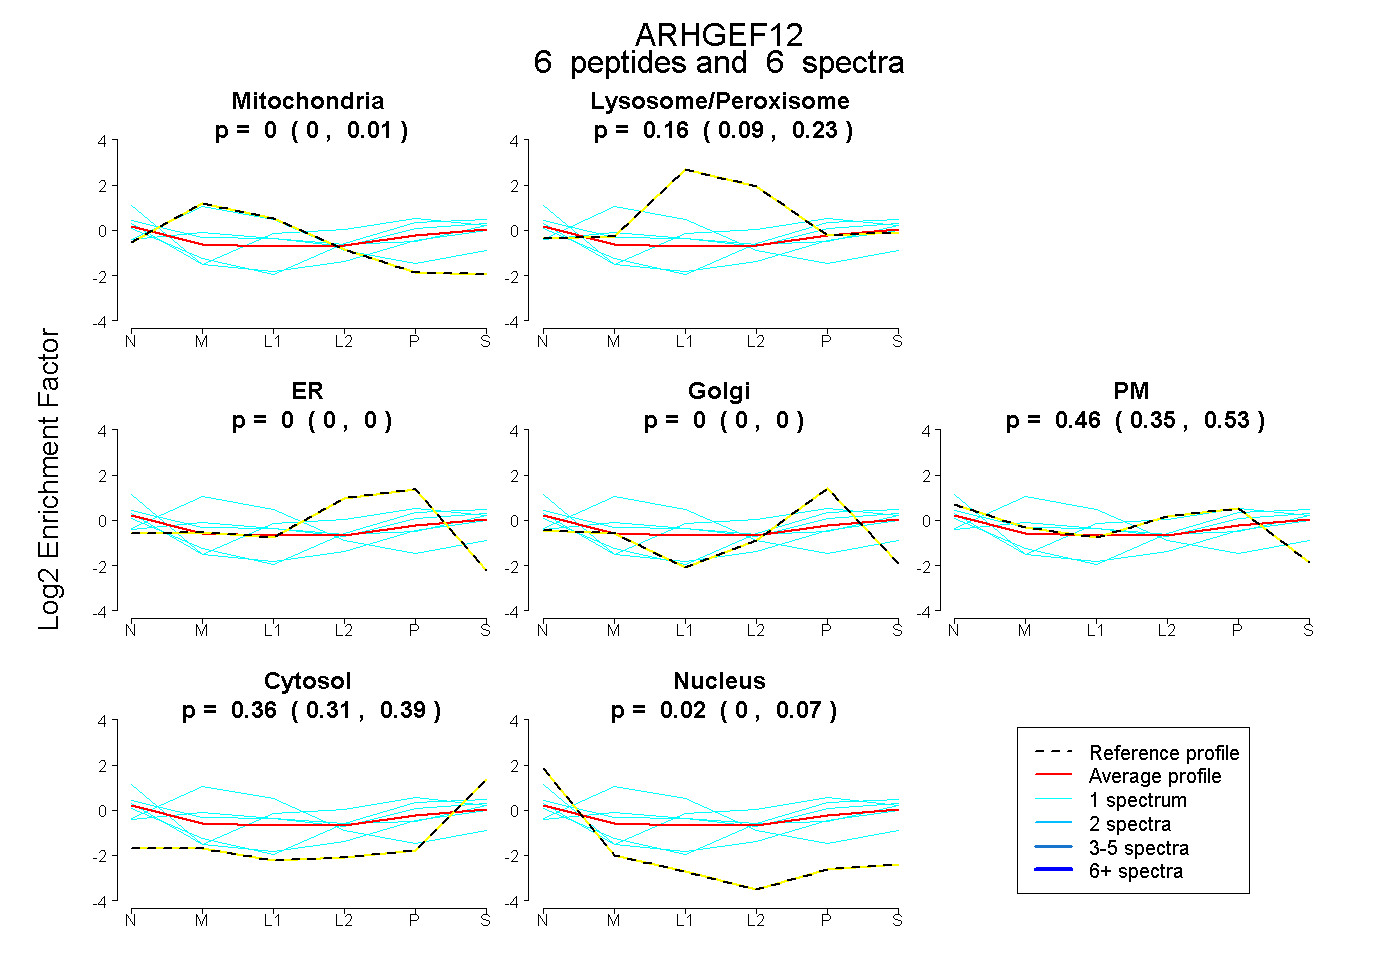 |
0.000
0.000 | 0.011 |
|
0.161
0.089 | 0.231 |
|
0.000
0.000 | 0.000 |
0.000
0.000 | 0.000 |
0.462
0.354 | 0.528 |
0.358
0.309 | 0.393 |
0.019
0.000 | 0.069 |
|
| 1 spectrum, LSEYPNVDELR |
0.053 |
|
0.308 |
|
0.000 |
0.273 |
0.046 |
0.320 |
0.000 |
|
| 1 spectrum, LSTVLVR |
0.000 |
|
0.000 |
|
0.000 |
0.000 |
0.444 |
0.342 |
0.214 |
|
| 1 spectrum, HLEDFR |
0.000 |
|
0.330 |
|
0.000 |
0.132 |
0.288 |
0.250 |
0.000 |
|
| 1 spectrum, EGILSPSELR |
0.000 |
|
0.000 |
|
0.000 |
0.147 |
0.414 |
0.439 |
0.000 |
|
| 1 spectrum, ACAEQIVTK |
0.000 |
|
0.280 |
|
0.000 |
0.000 |
0.333 |
0.307 |
0.080 |
|
| 1 spectrum, RPELIPEDLHR |
0.750 |
|
0.122 |
|
0.000 |
0.000 |
0.000 |
0.128 |
0.000 |
|
| | | Plot |
|
Lyso |
|
|
|
|
|
|
|
Other |
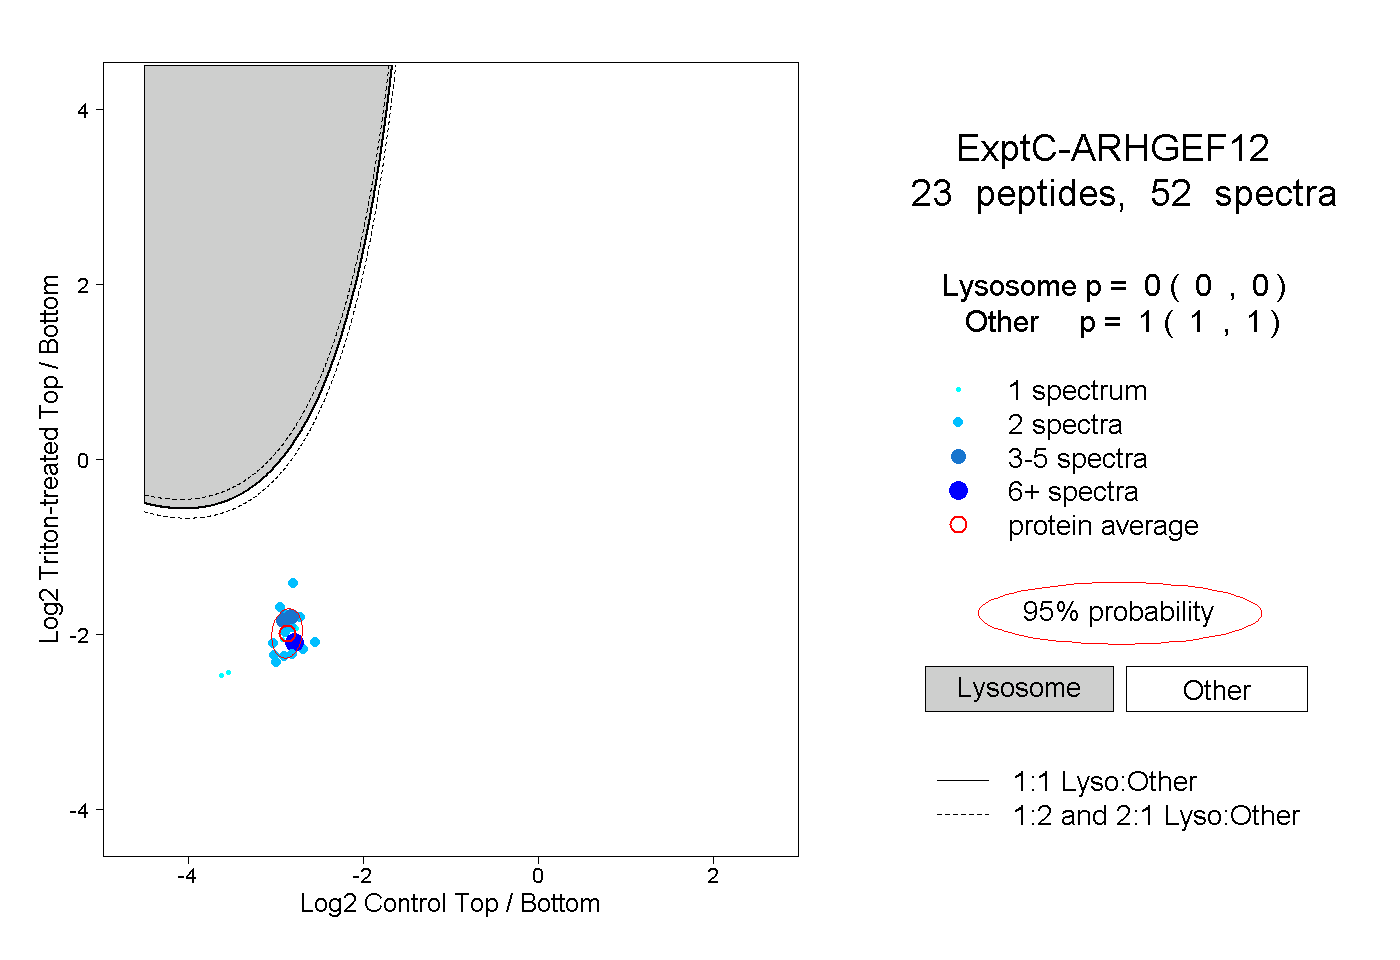
| Expt C |
23
peptides |
52
spectra |
 |
|
0.000
0.000 | 0.000 |
|
|
|
|
|
|
|
1.000
1.000 | 1.000 |
| | | Plot |
|
Lyso |
|
|
|
|
|
|
|
Other |
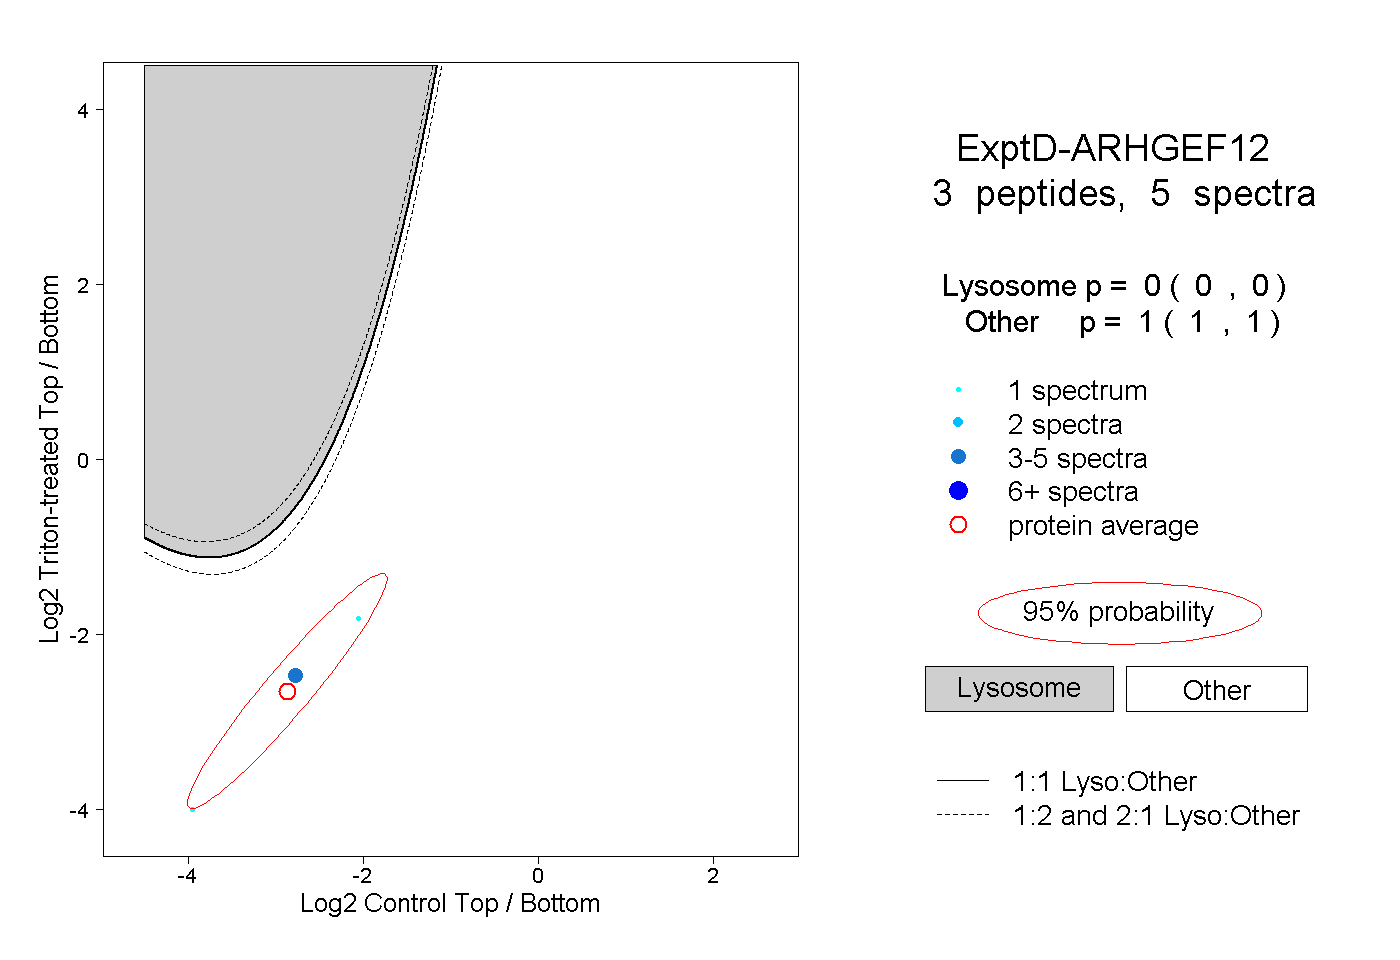
| Expt D |
3
peptides |
5
spectra |
 |
|
0.000
0.000 | 0.000 |
|
|
|
|
|
|
|
1.000
1.000 | 1.000 |