 19
19peptides
spectra
0.000 | 0.000
0.000 | 0.000
0.010 | 0.022
0.000 | 0.000
0.000 | 0.000
0.421 | 0.428
0.554 | 0.564
0.000 | 0.000
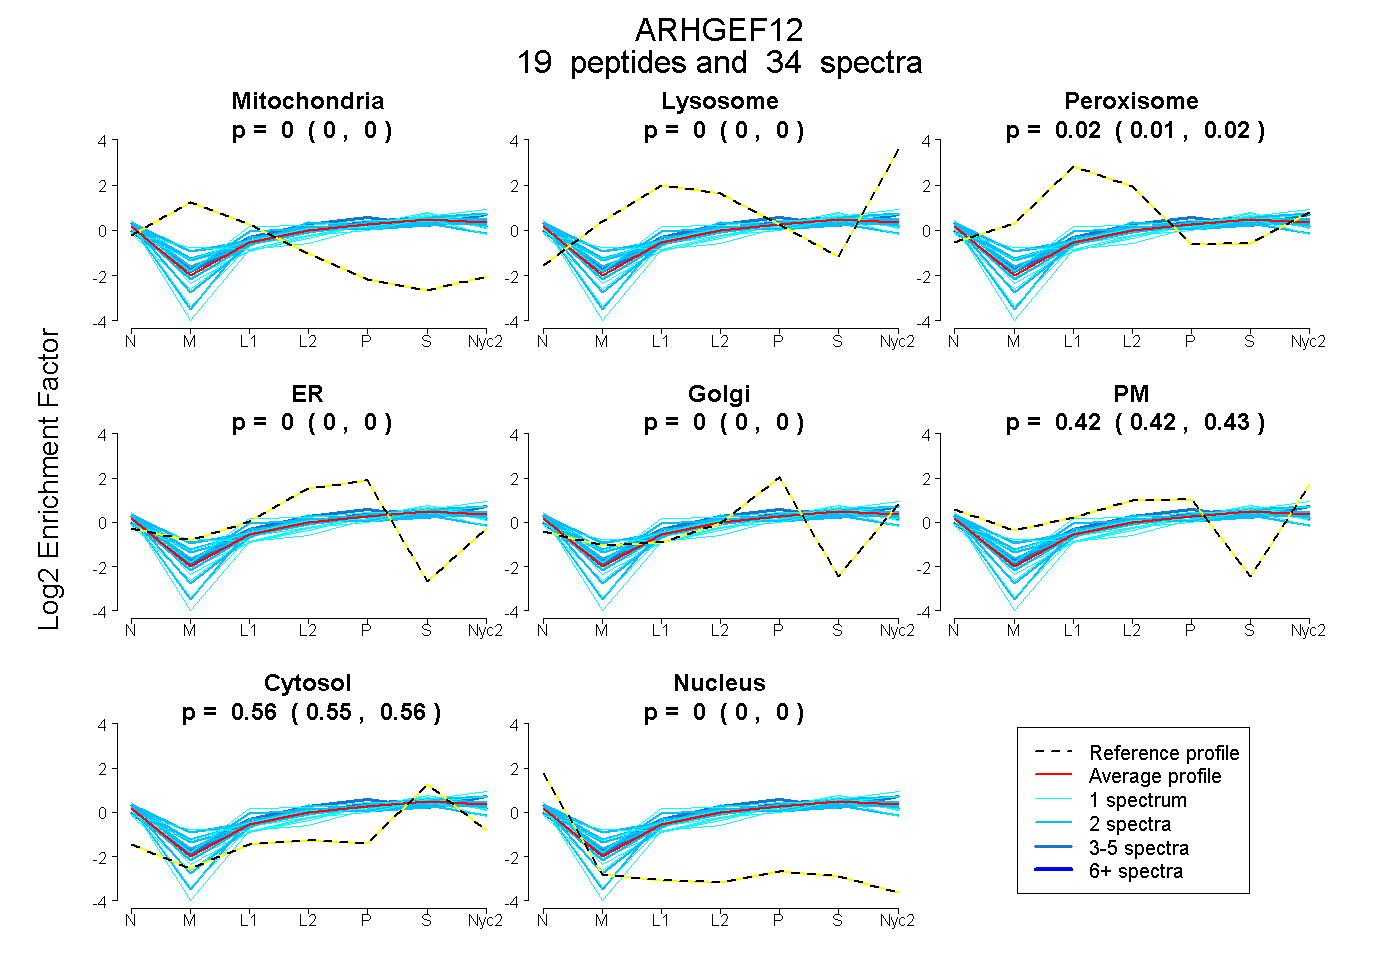
| Plot | Mito | Lyso | Perox | ER | Golgi | PM | Cytosol | Nucleus | |||||
| Expt A |
19 peptides |
34 spectra |
|
0.000 0.000 | 0.000 |
0.000 0.000 | 0.000 |
0.016 0.010 | 0.022 |
0.000 0.000 | 0.000 |
0.000 0.000 | 0.000 |
0.424 0.421 | 0.428 |
0.559 0.554 | 0.564 |
0.000 0.000 | 0.000 |
| 2 spectra, QILNYVNQAVR | 0.000 | 0.000 | 0.020 | 0.000 | 0.000 | 0.440 | 0.540 | 0.000 | ||
| 2 spectra, LSEYPNVDELR | 0.000 | 0.000 | 0.080 | 0.000 | 0.000 | 0.437 | 0.483 | 0.000 | ||
| 2 spectra, LEDYQR | 0.000 | 0.000 | 0.028 | 0.000 | 0.000 | 0.461 | 0.512 | 0.000 | ||
| 1 spectrum, HLEDFR | 0.000 | 0.000 | 0.000 | 0.004 | 0.020 | 0.342 | 0.634 | 0.000 | ||
| 1 spectrum, YRPASEEAQADSGIPDLESVK | 0.000 | 0.000 | 0.166 | 0.000 | 0.000 | 0.381 | 0.453 | 0.000 | ||
| 1 spectrum, TEGVQDADTQSLVGSPSTR | 0.000 | 0.000 | 0.000 | 0.030 | 0.000 | 0.324 | 0.647 | 0.000 | ||
| 2 spectra, TGTGDVATCDSPR | 0.000 | 0.000 | 0.000 | 0.000 | 0.000 | 0.427 | 0.573 | 0.000 | ||
| 1 spectrum, YPLLLDNIAK | 0.000 | 0.144 | 0.011 | 0.000 | 0.000 | 0.335 | 0.509 | 0.000 | ||
| 2 spectra, TDWSSGDASRPSSDSADSPK | 0.000 | 0.000 | 0.000 | 0.000 | 0.000 | 0.374 | 0.626 | 0.000 | ||
| 1 spectrum, EGDGGYPVTISDPHLPVSEER | 0.000 | 0.000 | 0.000 | 0.000 | 0.086 | 0.192 | 0.722 | 0.000 | ||
| 4 spectra, AGVQTGDR | 0.000 | 0.000 | 0.040 | 0.000 | 0.000 | 0.508 | 0.452 | 0.000 | ||
| 2 spectra, LSTVLVR | 0.000 | 0.000 | 0.111 | 0.000 | 0.000 | 0.434 | 0.455 | 0.000 | ||
| 2 spectra, VCLEDTPER | 0.000 | 0.000 | 0.000 | 0.005 | 0.000 | 0.405 | 0.591 | 0.000 | ||
| 2 spectra, FQTFVQDAESNPLCR | 0.000 | 0.000 | 0.080 | 0.114 | 0.000 | 0.308 | 0.498 | 0.000 | ||
| 1 spectrum, SMGLTLAESELTK | 0.000 | 0.000 | 0.000 | 0.060 | 0.000 | 0.281 | 0.659 | 0.000 | ||
| 1 spectrum, LQLLQEDYNR | 0.000 | 0.000 | 0.000 | 0.000 | 0.038 | 0.364 | 0.592 | 0.006 | ||
| 4 spectra, DIIPTQMQR | 0.000 | 0.000 | 0.041 | 0.061 | 0.000 | 0.334 | 0.564 | 0.000 | ||
| 1 spectrum, VSVPEEISVDLEK | 0.019 | 0.000 | 0.068 | 0.029 | 0.000 | 0.316 | 0.567 | 0.000 | ||
| 2 spectra, VHPEVQR | 0.000 | 0.000 | 0.110 | 0.000 | 0.000 | 0.397 | 0.493 | 0.000 |
| Plot | Mito | Lyso or Perox | ER | Golgi | PM | Cytosol | Nucleus | ||||||
| Expt B |
6 peptides |
6 spectra |
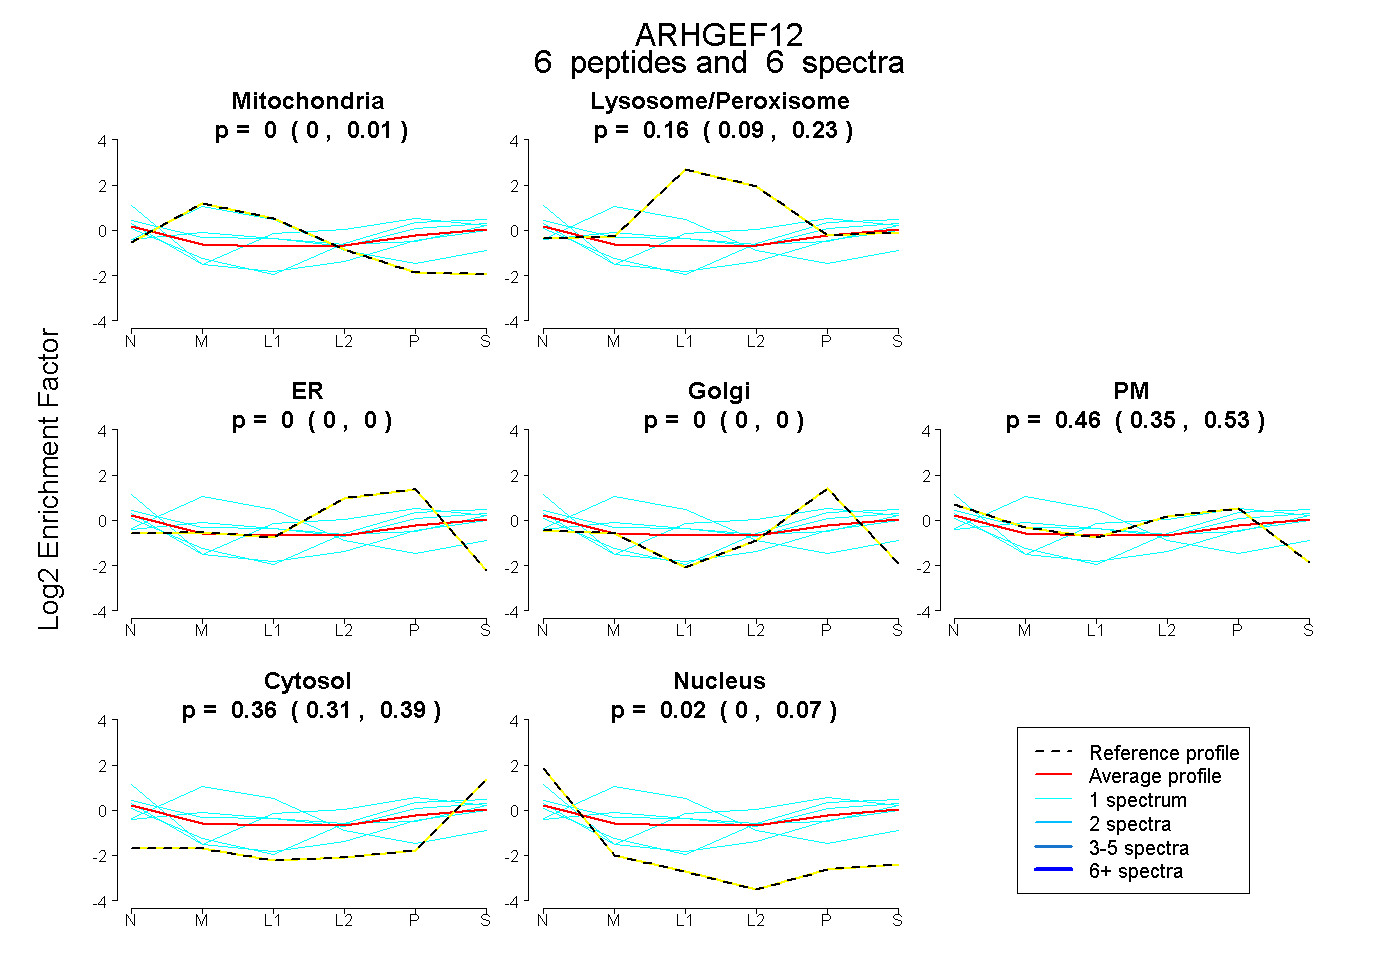 |
0.000 0.000 | 0.011 |
0.161 0.089 | 0.231 |
0.000 0.000 | 0.000 |
0.000 0.000 | 0.000 |
0.462 0.354 | 0.528 |
0.358 0.309 | 0.393 |
0.019 0.000 | 0.069 |
|||
| Plot | Lyso | Other | |||||||||||
| Expt C |
23 peptides |
52 spectra |
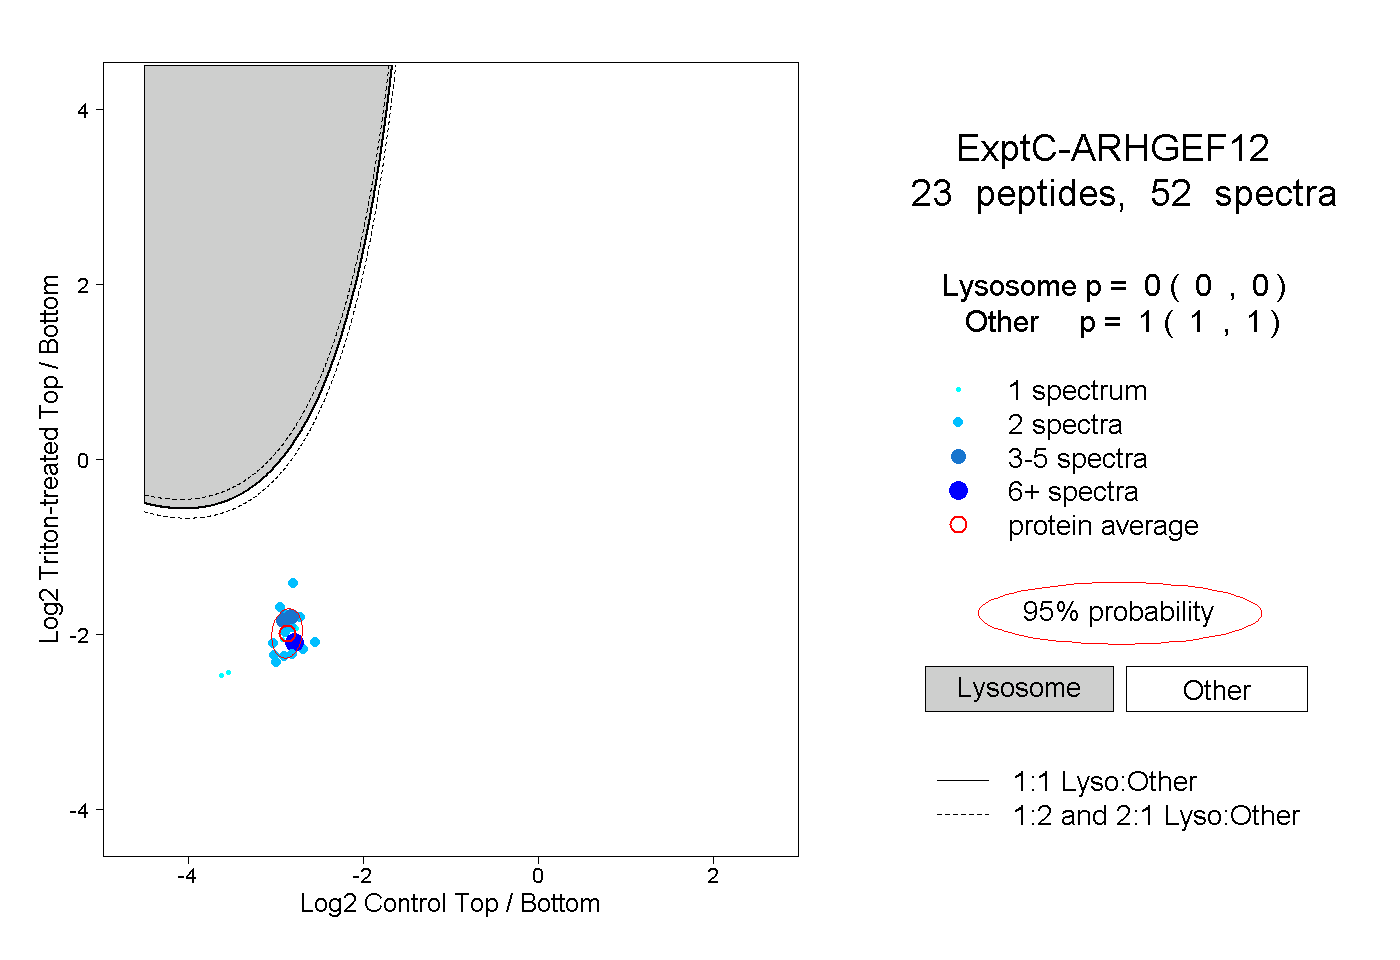 |
0.000 0.000 | 0.000 |
1.000 1.000 | 1.000 |
||||||||
| Plot | Lyso | Other | |||||||||||
| Expt D |
3 peptides |
5 spectra |
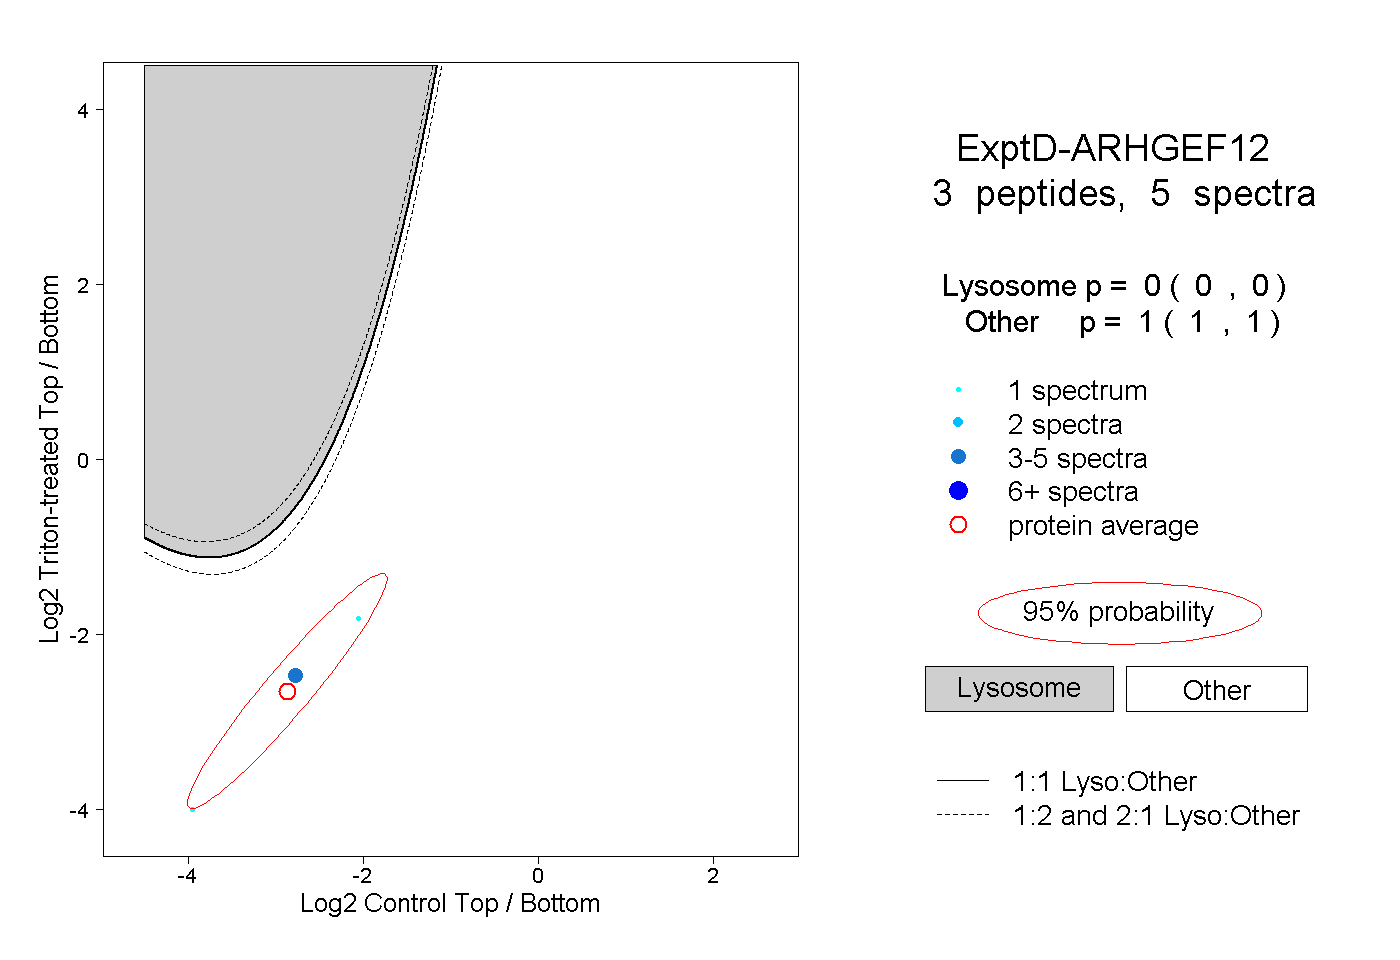 |
0.000 0.000 | 0.000 |
1.000 1.000 | 1.000 |