 19
19peptides
spectra
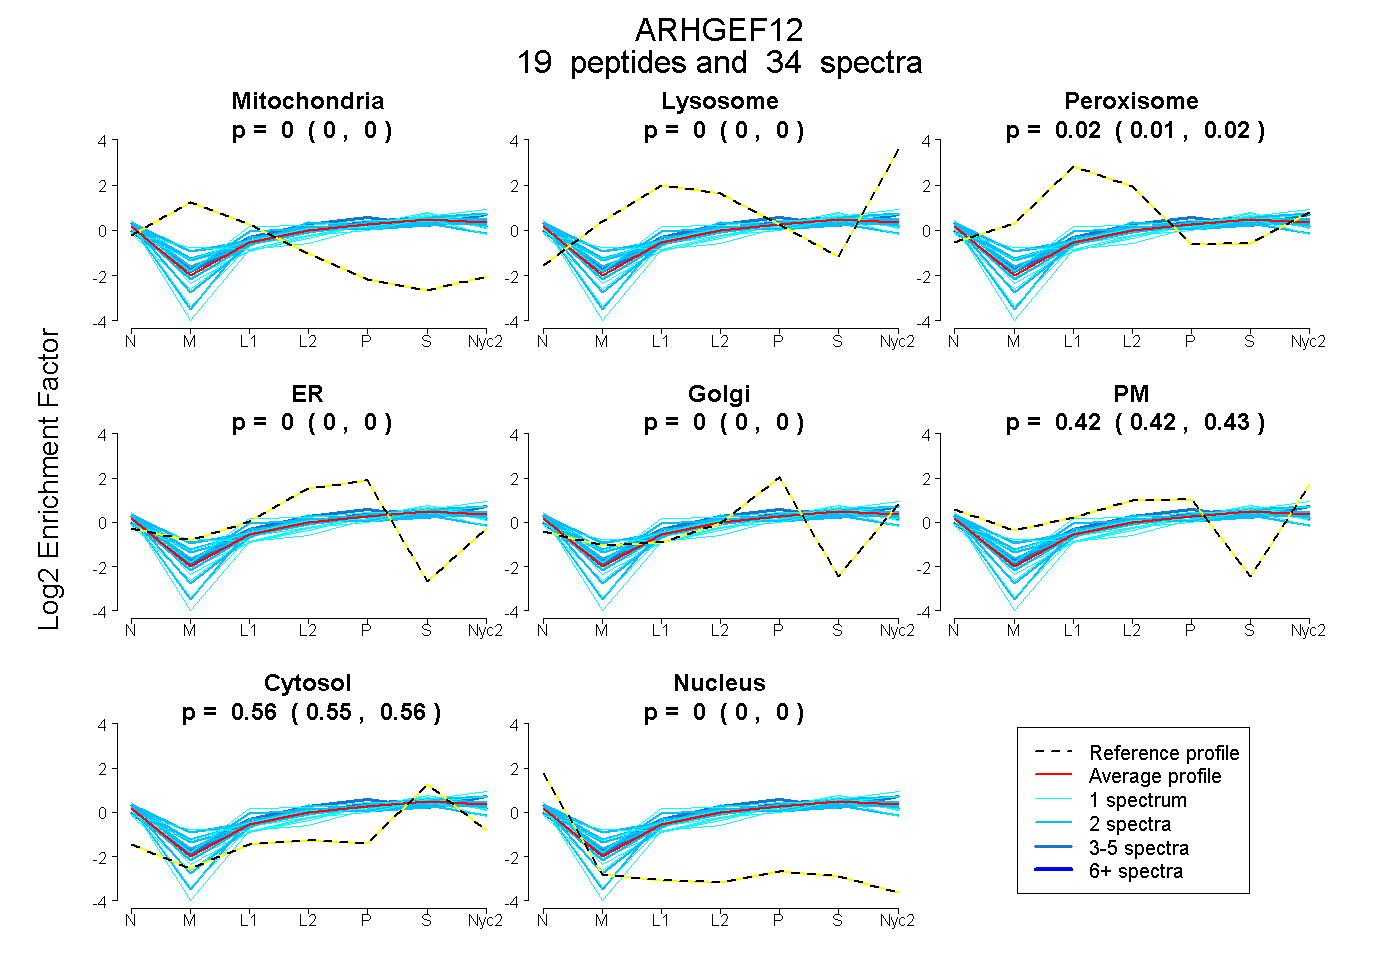
0.000 | 0.000
0.000 | 0.000
0.010 | 0.022
0.000 | 0.000
0.000 | 0.000
0.421 | 0.428
0.554 | 0.564
0.000 | 0.000
6peptides
spectra
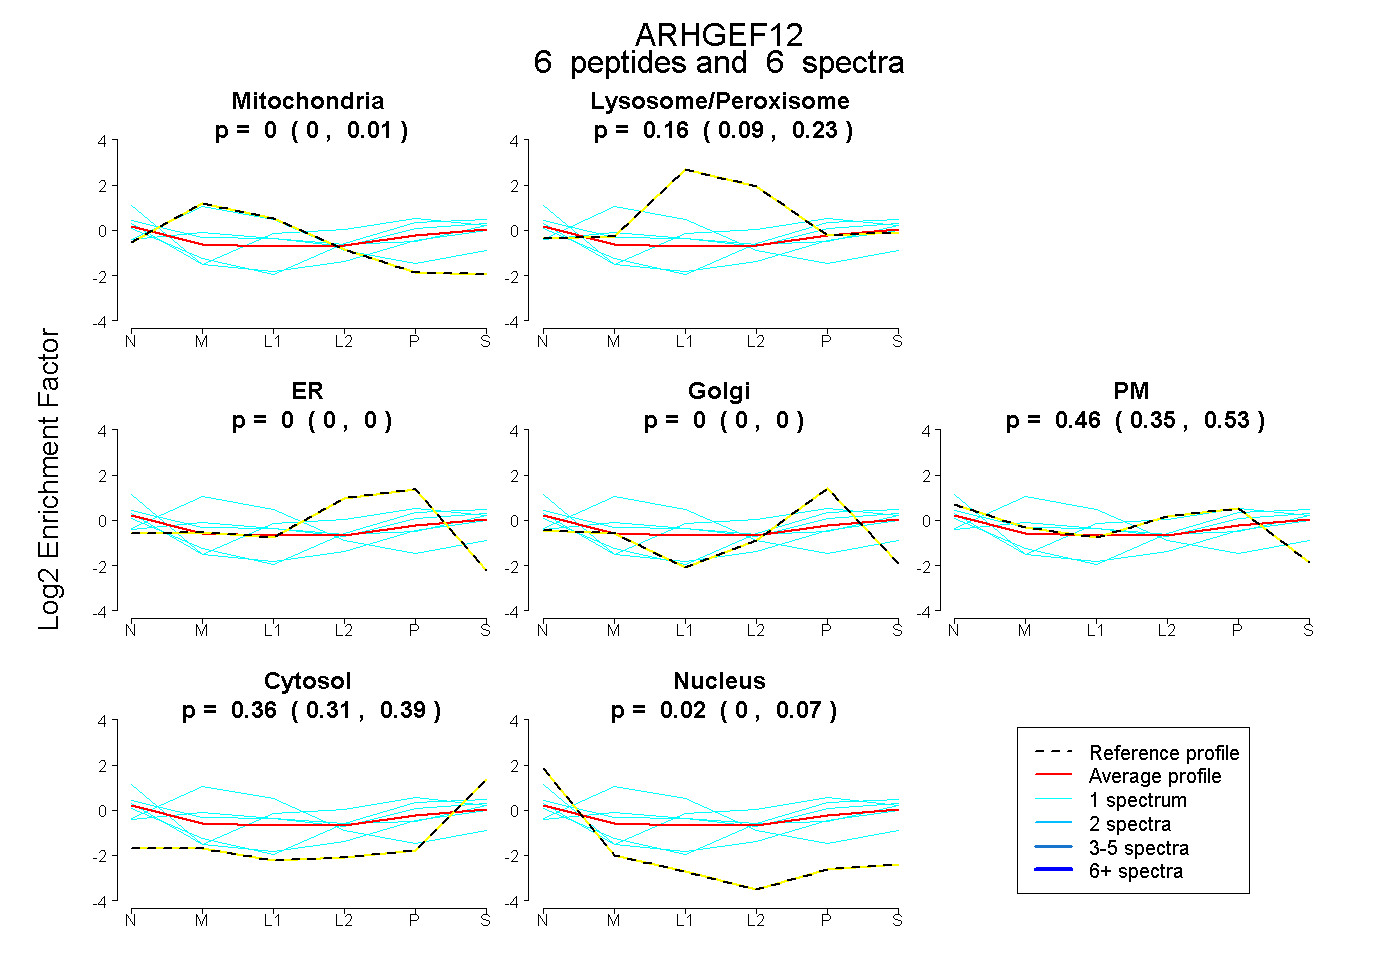
0.000 | 0.011
0.089 | 0.231
0.000 | 0.000
0.000 | 0.000
0.354 | 0.528
0.309 | 0.393
0.000 | 0.069
23peptides
spectra
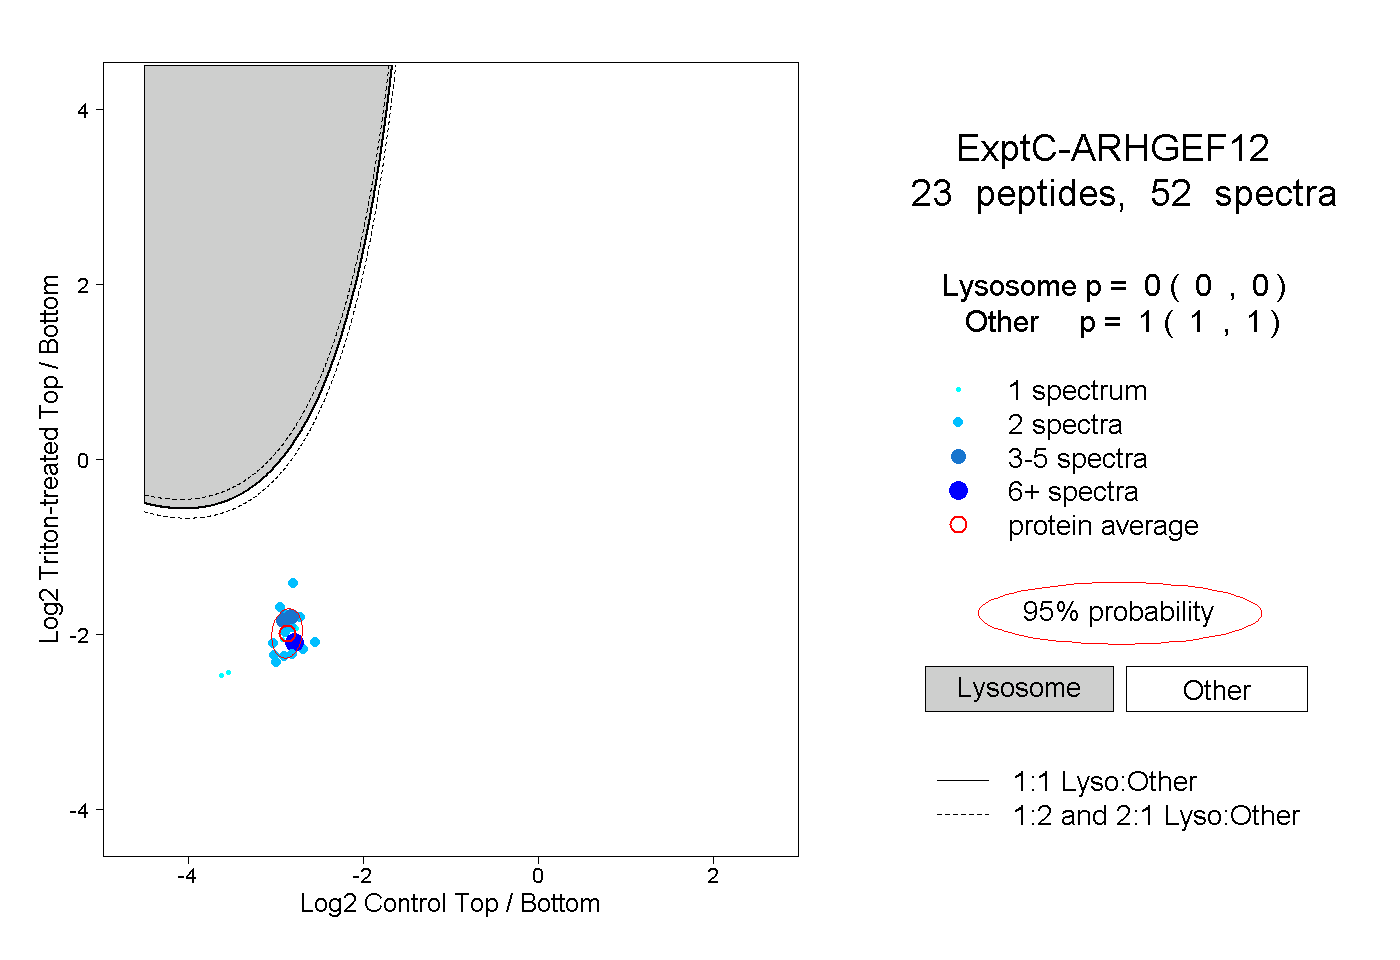
0.000 | 0.000
1.000 | 1.000
3peptides
spectra
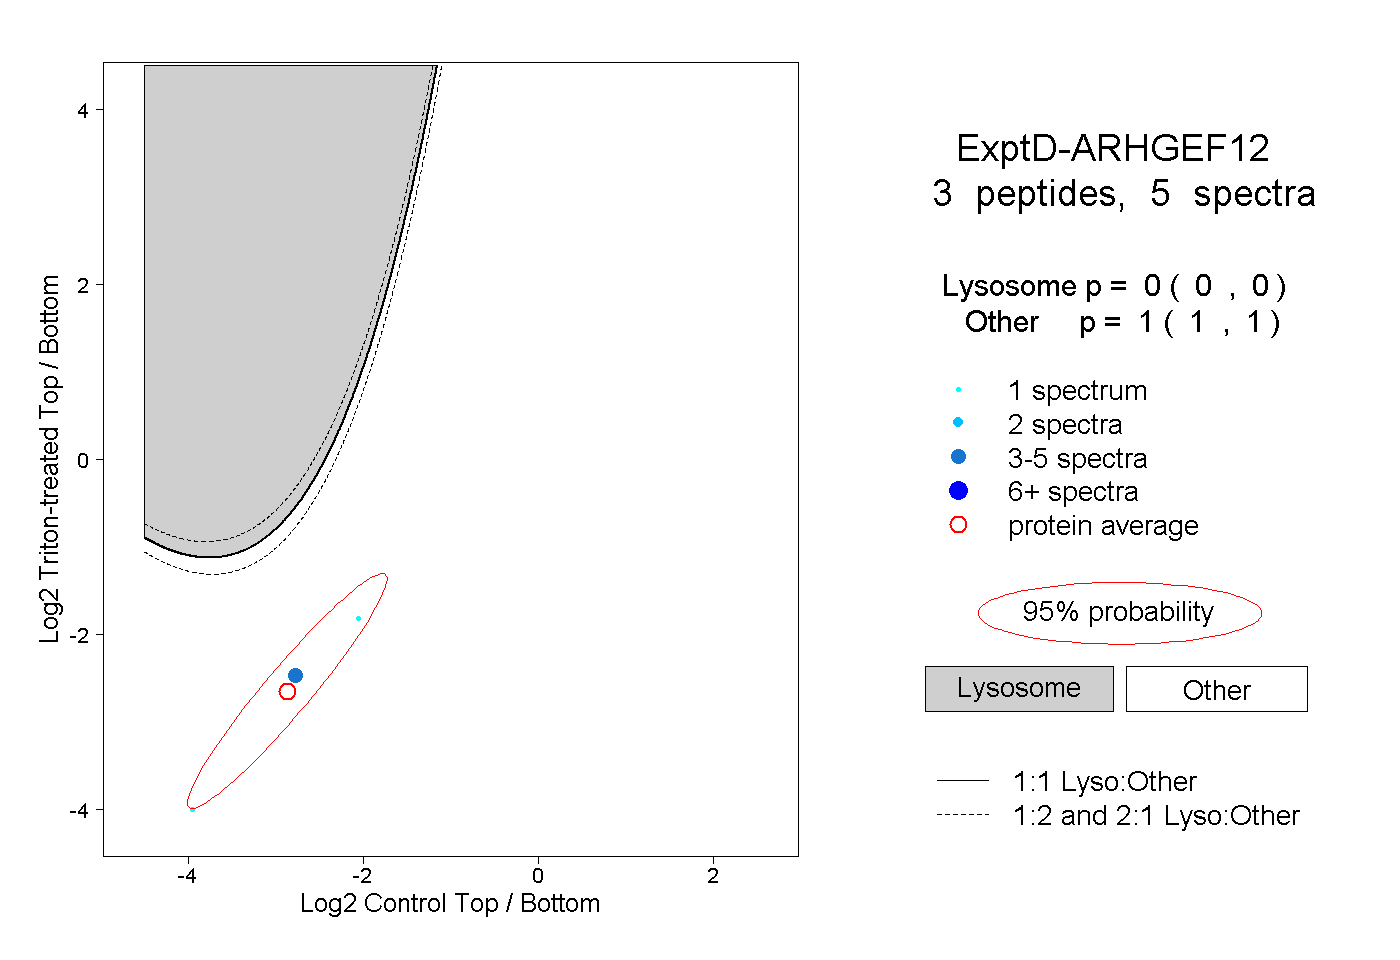
0.000 | 0.000
1.000 | 1.000