 4
4peptides
spectra
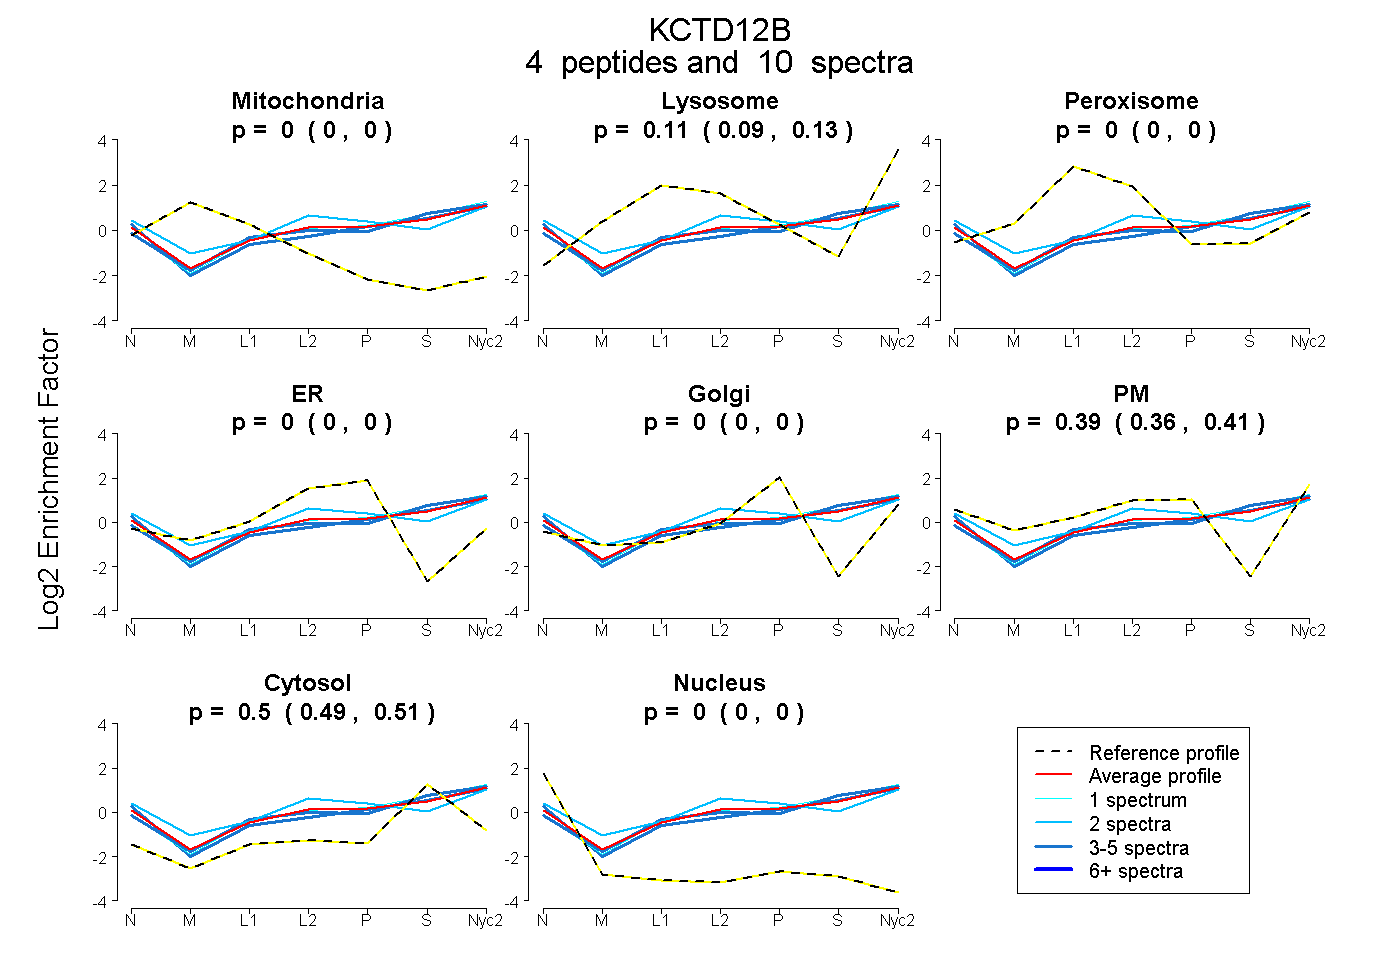
0.000 | 0.000
0.094 | 0.127
0.000 | 0.000
0.000 | 0.000
0.000 | 0.000
0.361 | 0.408
0.487 | 0.512
0.000 | 0.000
2peptides
spectra
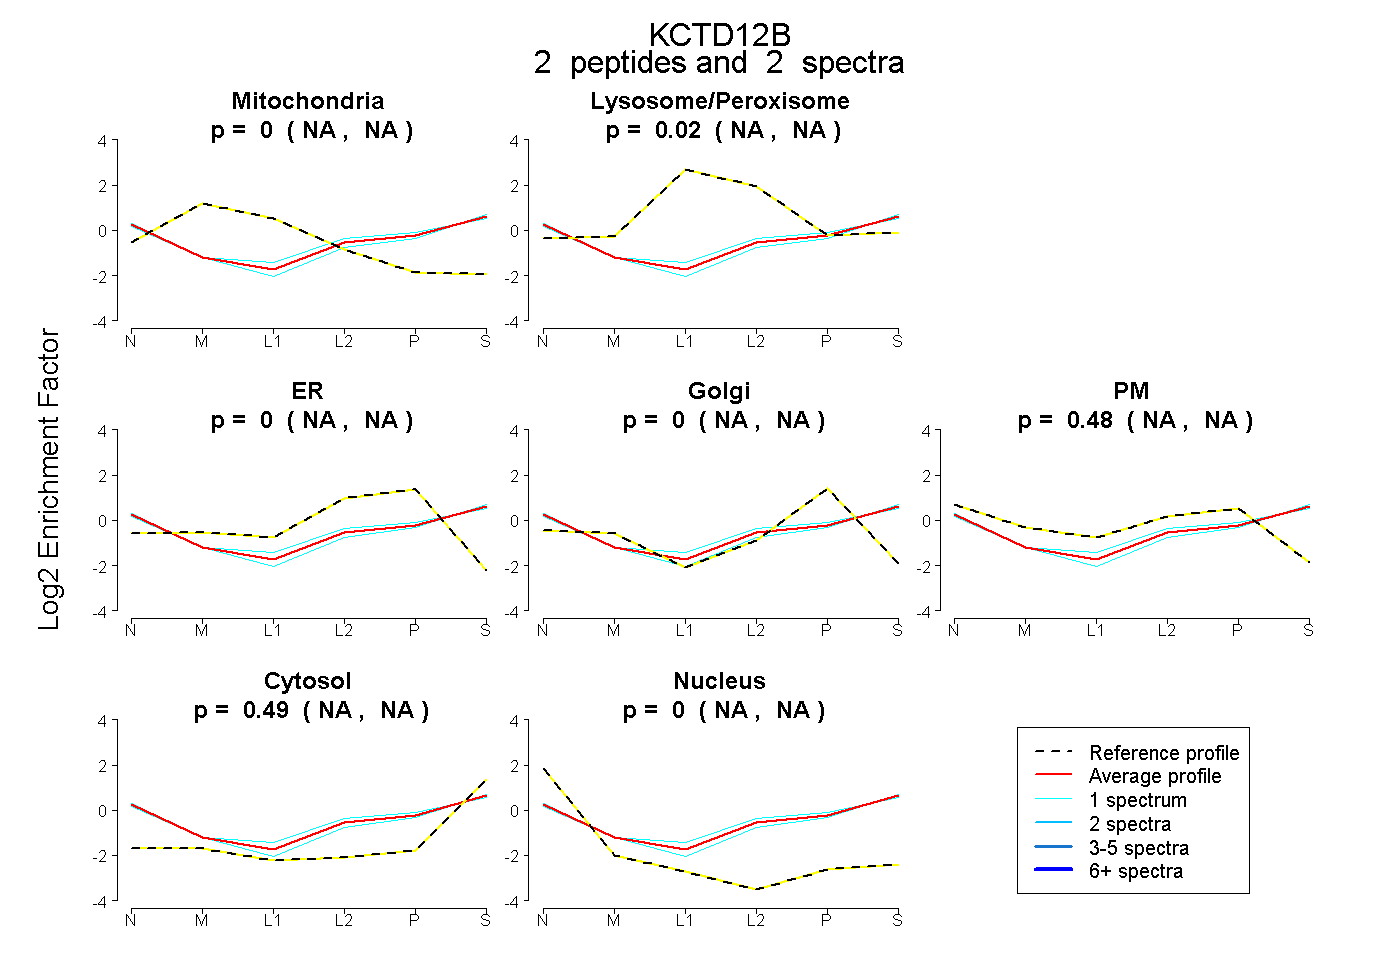
NA | NA
NA | NA
NA | NA
NA | NA
NA | NA
NA | NA
NA | NA
4peptides
spectra
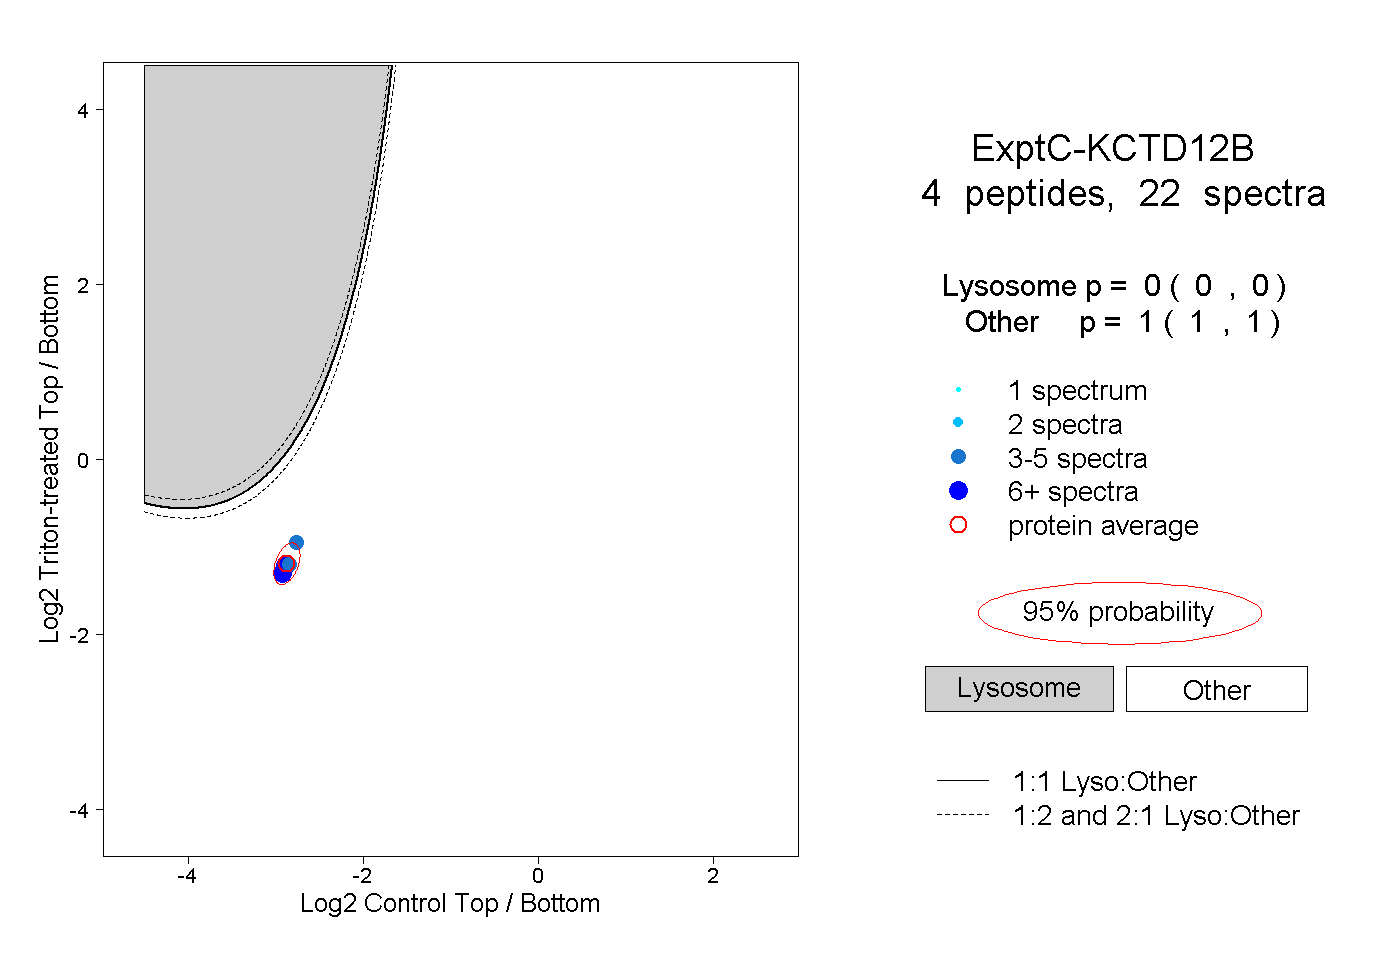
0.000 | 0.000
1.000 | 1.000
1peptide
spectra
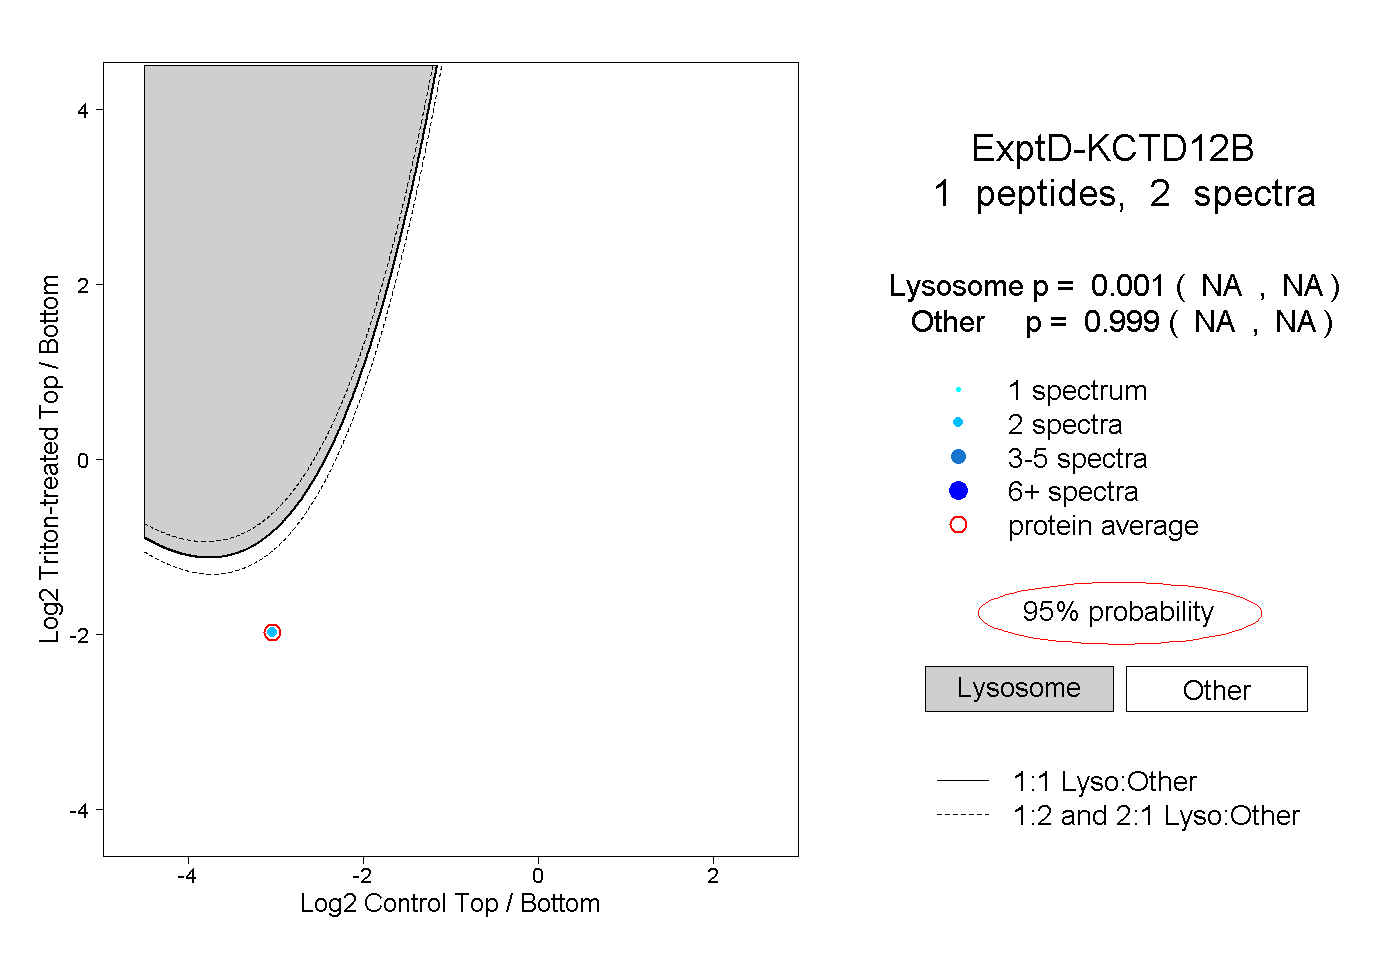
NA | NA
NA | NA