 2
2peptides
spectra
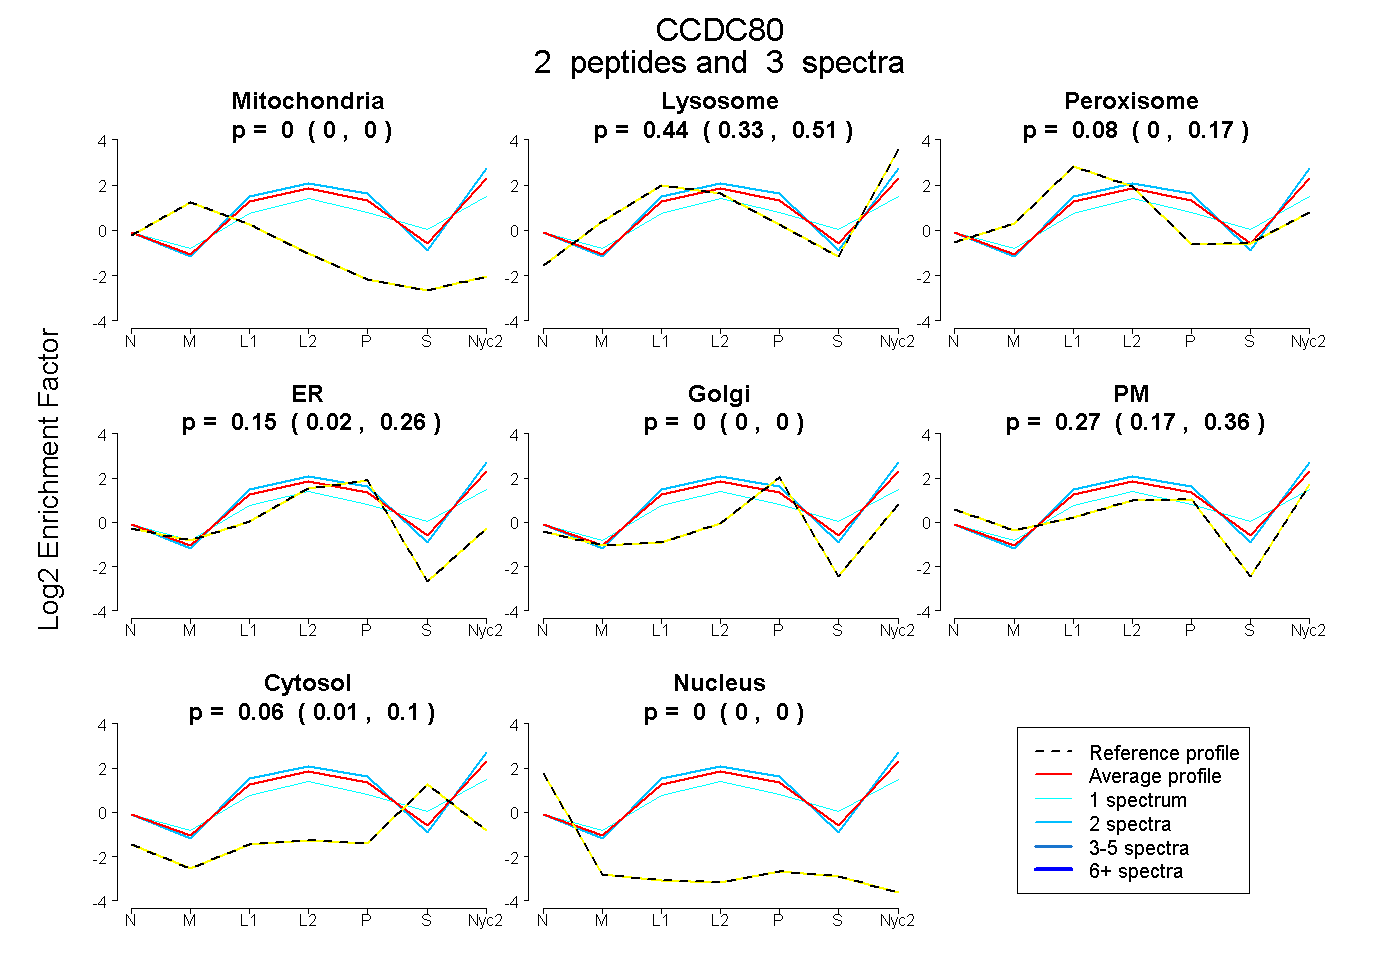
0.000 | 0.000
0.329 | 0.513
0.000 | 0.173
0.022 | 0.264
0.000 | 0.000
0.167 | 0.363
0.013 | 0.097
0.000 | 0.000
| Plot | Mito | Lyso | Perox | ER | Golgi | PM | Cytosol | Nucleus | |||||
| Expt A |
2 peptides |
3 spectra |
|
0.000 0.000 | 0.000 |
0.438 0.329 | 0.513 |
0.080 0.000 | 0.173 |
0.150 0.022 | 0.264 |
0.000 0.000 | 0.000 |
0.272 0.167 | 0.363 |
0.059 0.013 | 0.097 |
0.000 0.000 | 0.000 |
| 1 spectrum, DEYLESFCK | 0.000 | 0.226 | 0.223 | 0.050 | 0.000 | 0.292 | 0.209 | 0.000 | ||
| 2 spectra, DDVYCELAER | 0.000 | 0.548 | 0.000 | 0.194 | 0.000 | 0.258 | 0.000 | 0.000 |
| Plot | Lyso | Other | |||||||||||
| Expt C |
3 peptides |
5 spectra |
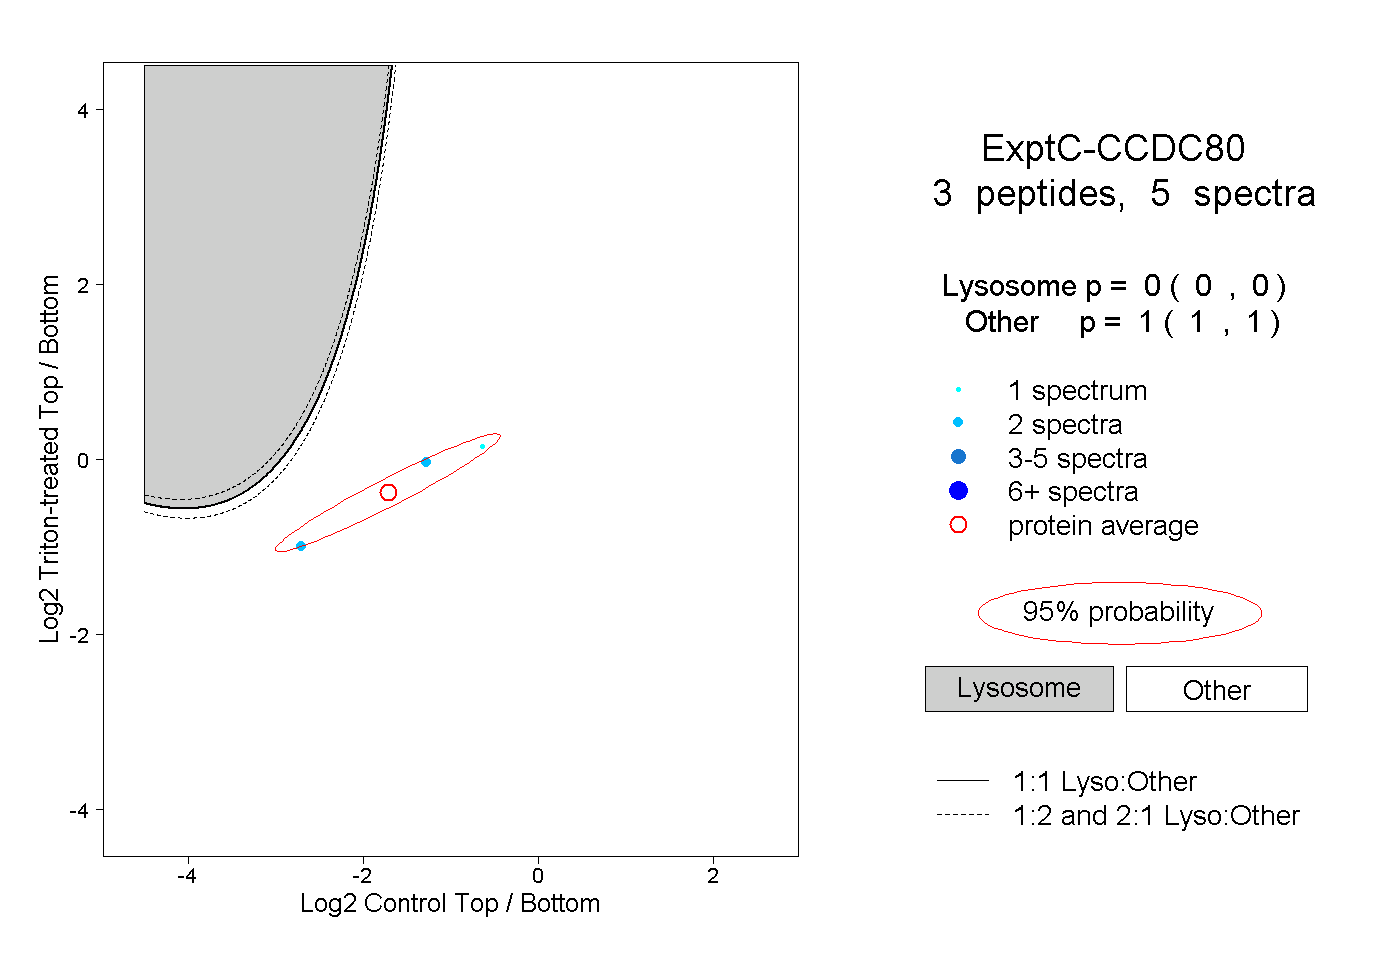 |
0.000 0.000 | 0.000 |
1.000 1.000 | 1.000 |