 4
4peptides
spectra
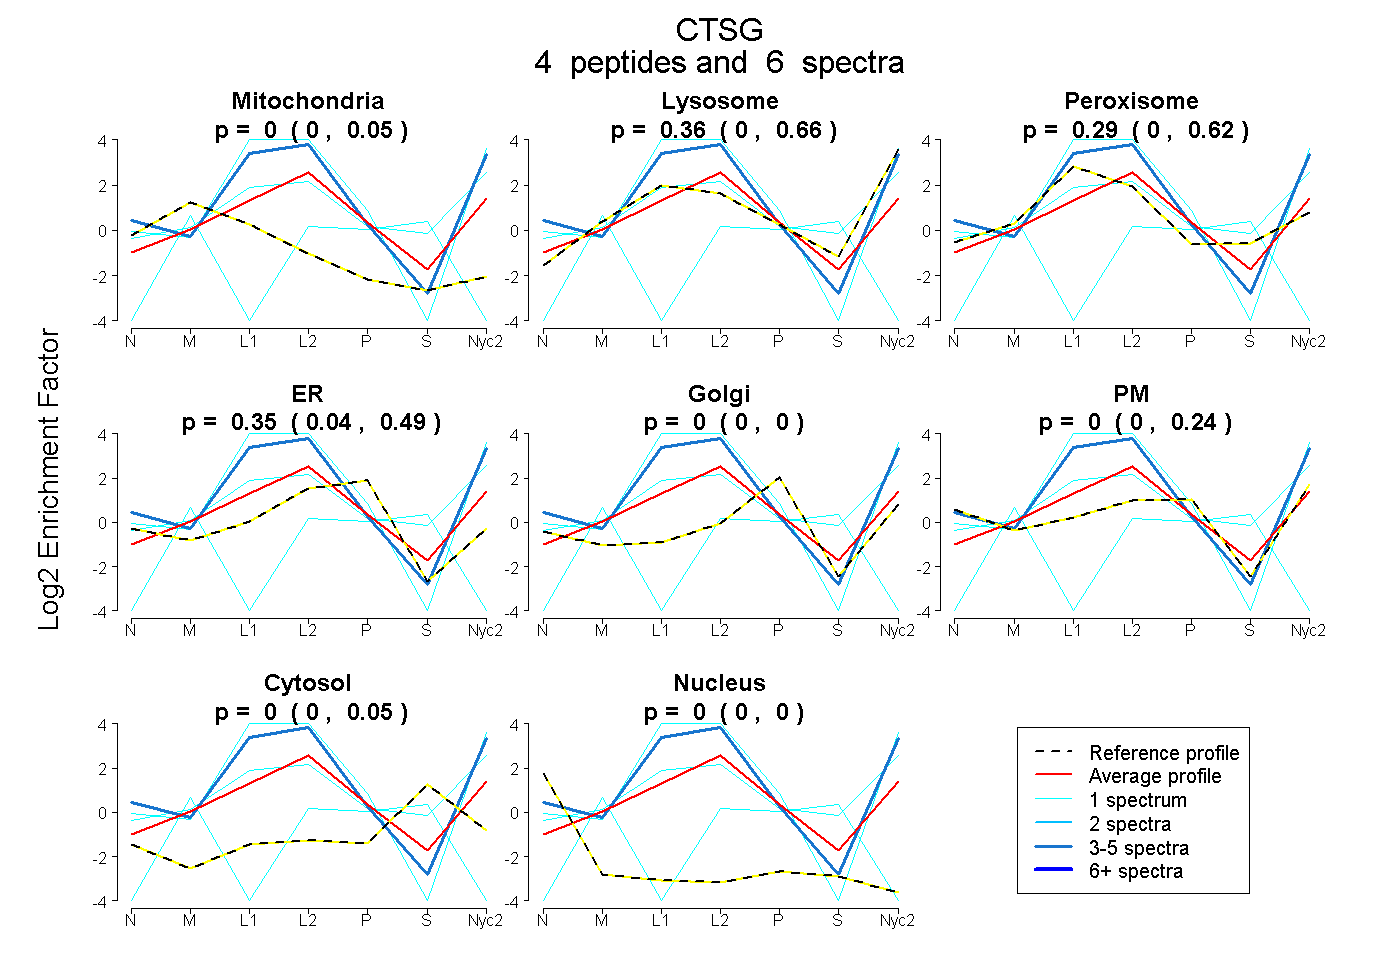
0.000 | 0.051
0.000 | 0.660
0.000 | 0.622
0.043 | 0.494
0.000 | 0.000
0.000 | 0.237
0.000 | 0.055
0.000 | 0.000
1peptide
spectrum
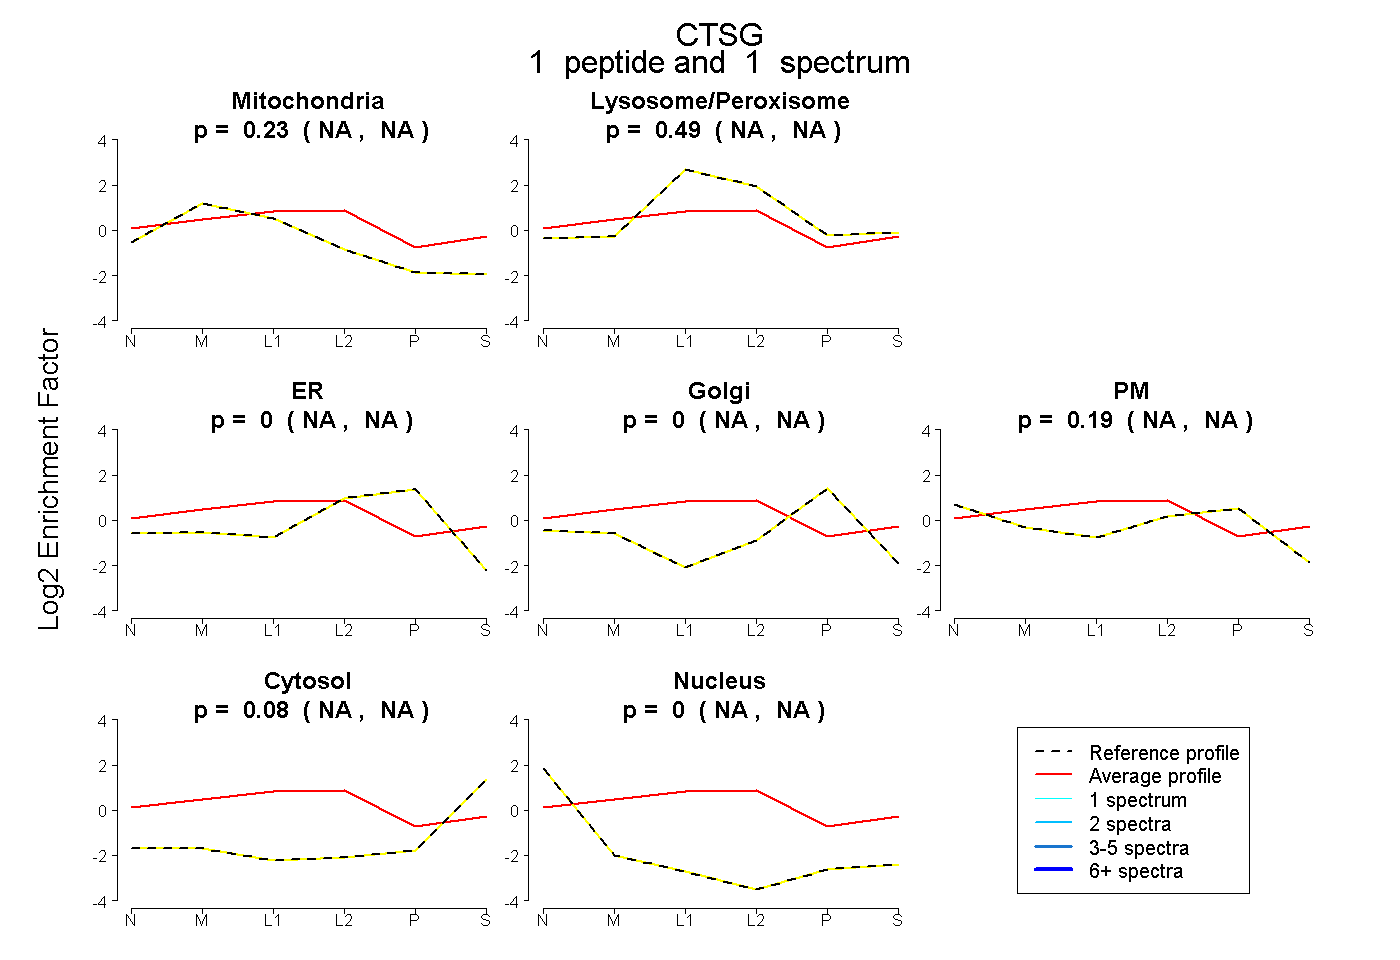
NA | NA
NA | NA
NA | NA
NA | NA
NA | NA
NA | NA
NA | NA
4peptides
spectra
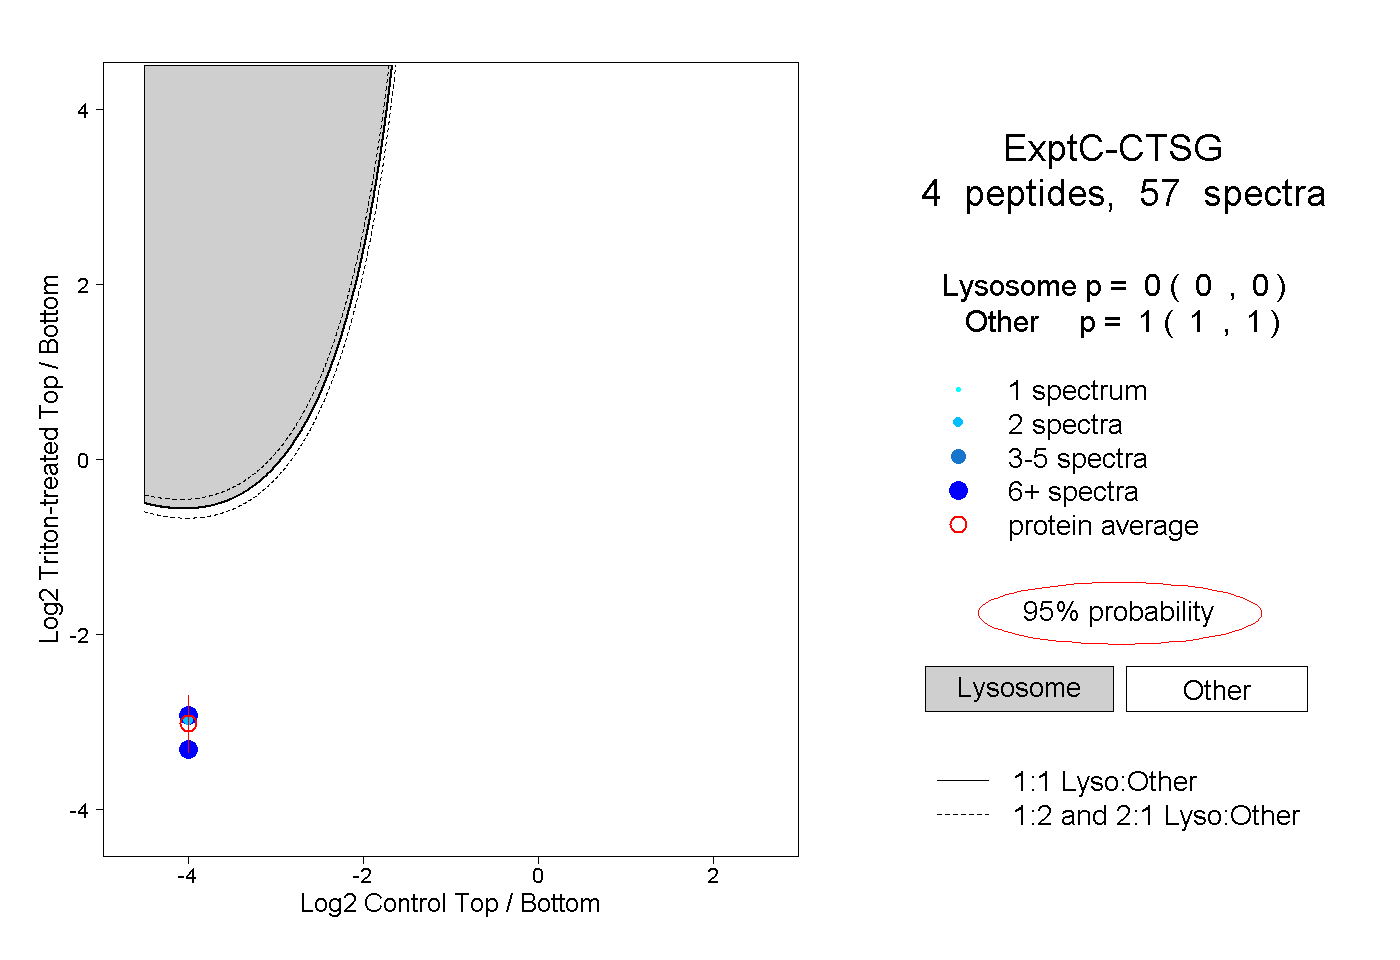
0.000 | 0.000
1.000 | 1.000
2peptides
spectra
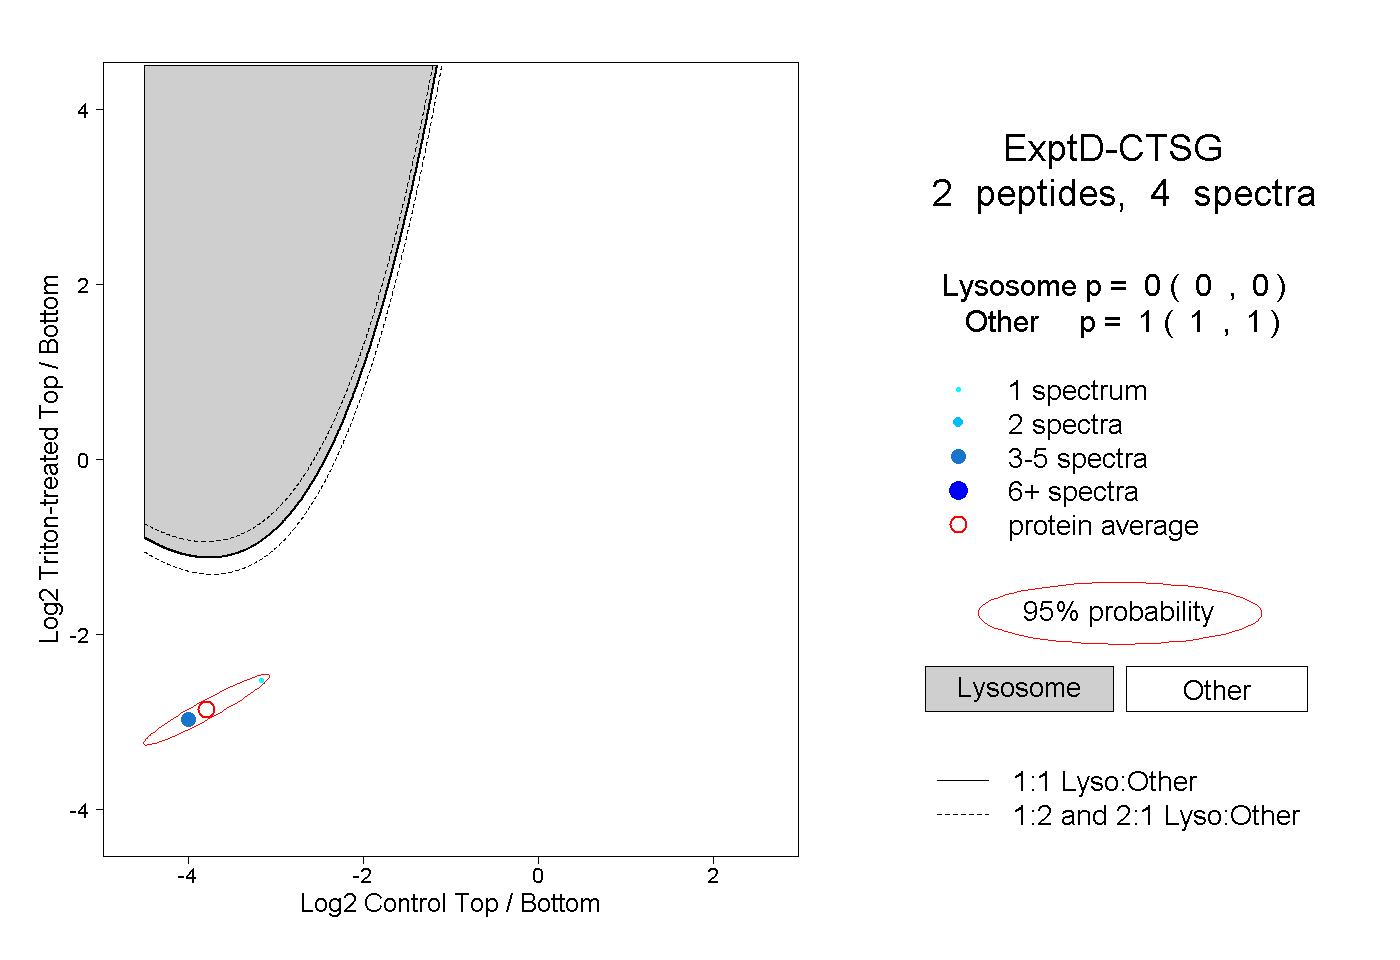
0.000 | 0.000
1.000 | 1.000