 4
4peptides
spectra
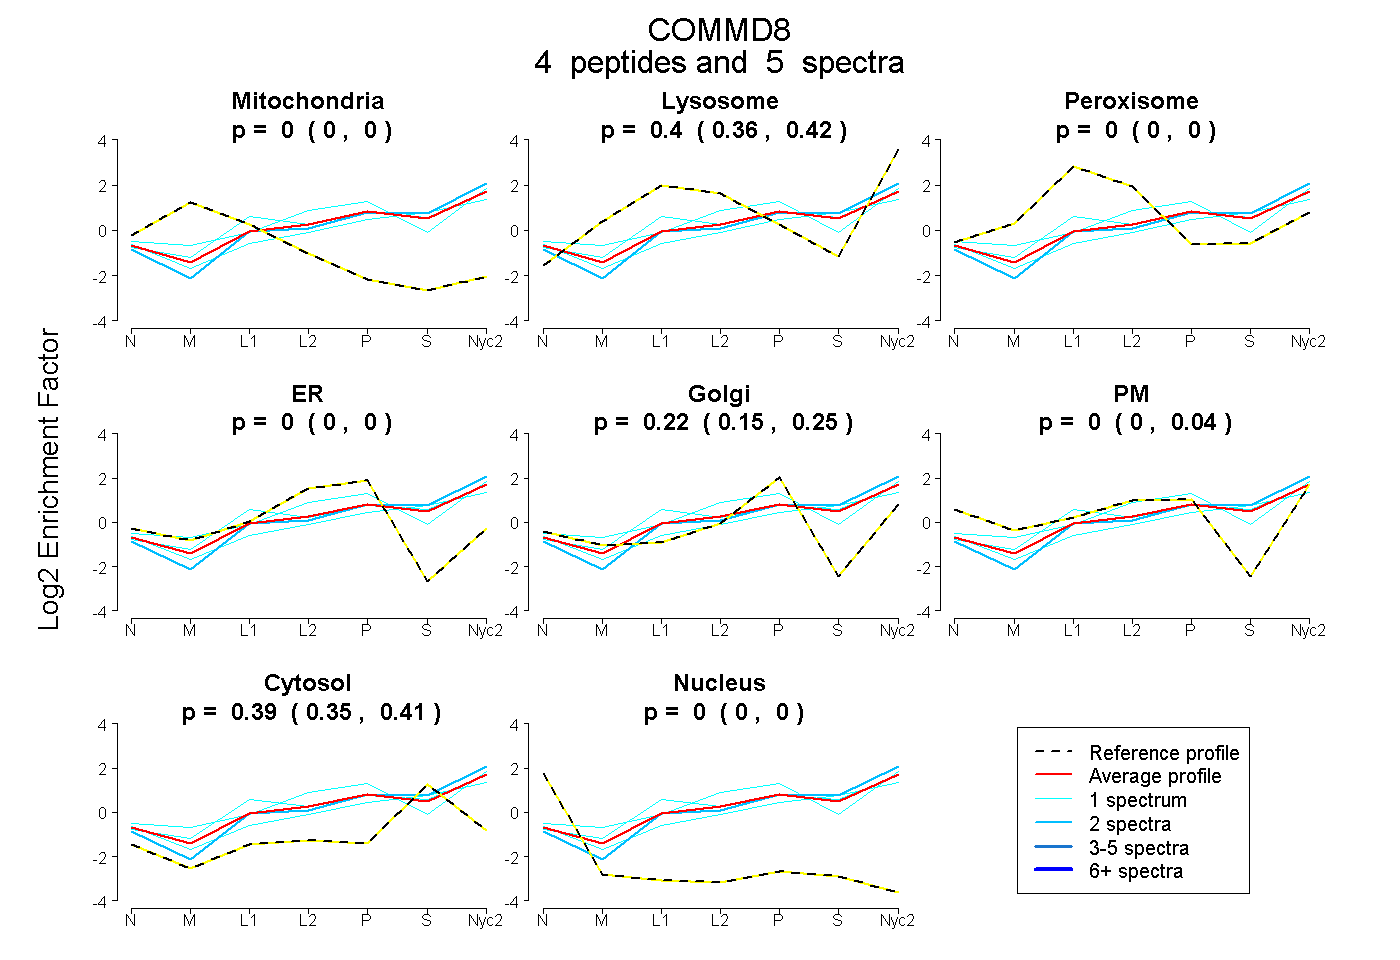
0.000 | 0.000
0.360 | 0.421
0.000 | 0.000
0.000 | 0.000
0.150 | 0.252
0.000 | 0.043
0.355 | 0.411
0.000 | 0.000
5peptides
spectra
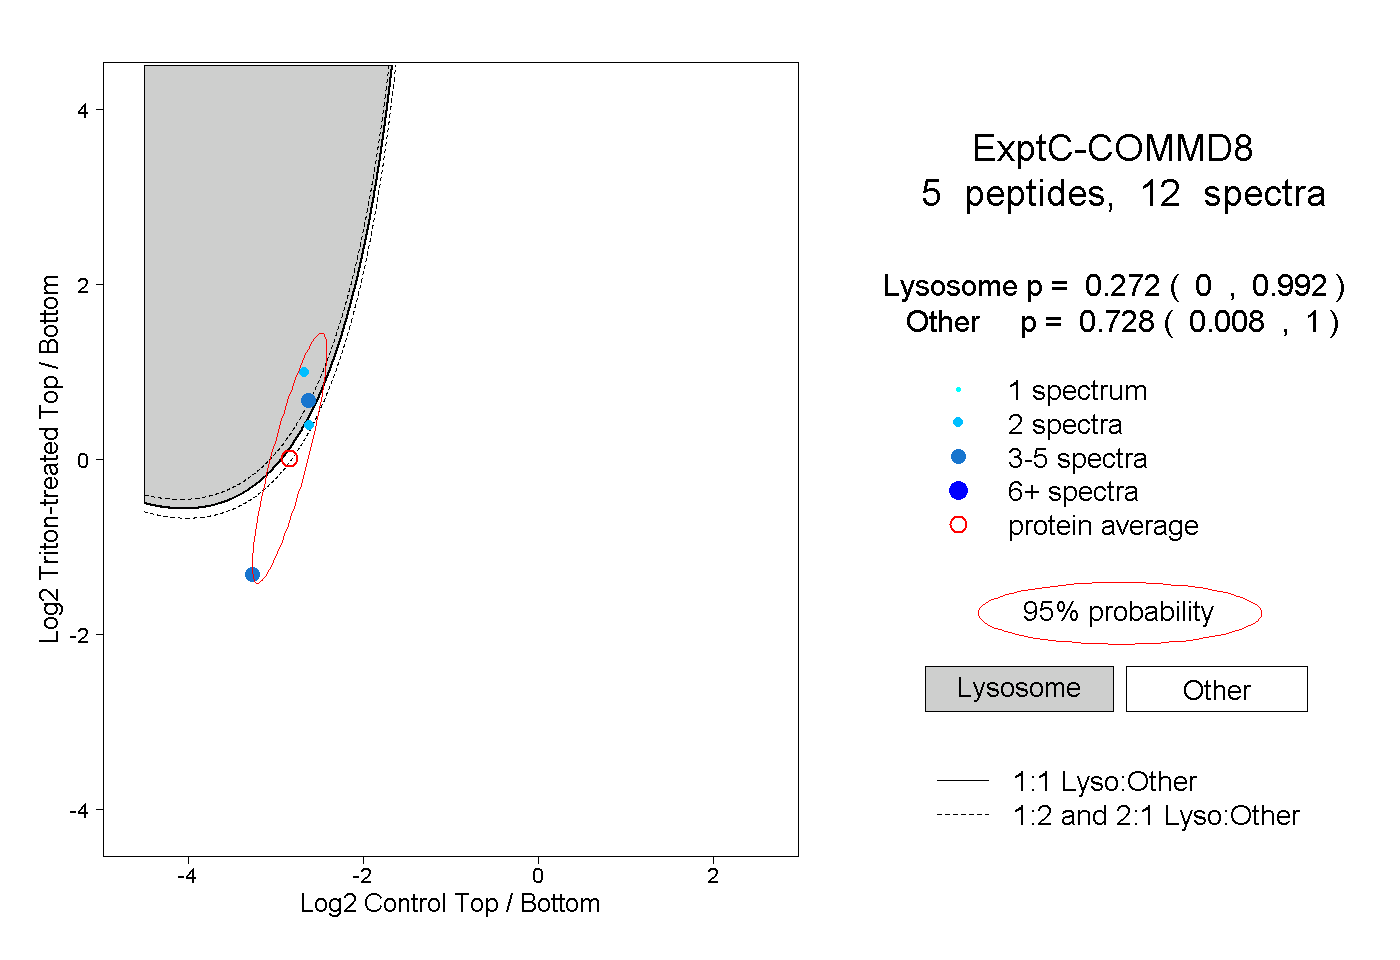
0.000 | 0.992
0.008 | 1.000
1peptide
spectra
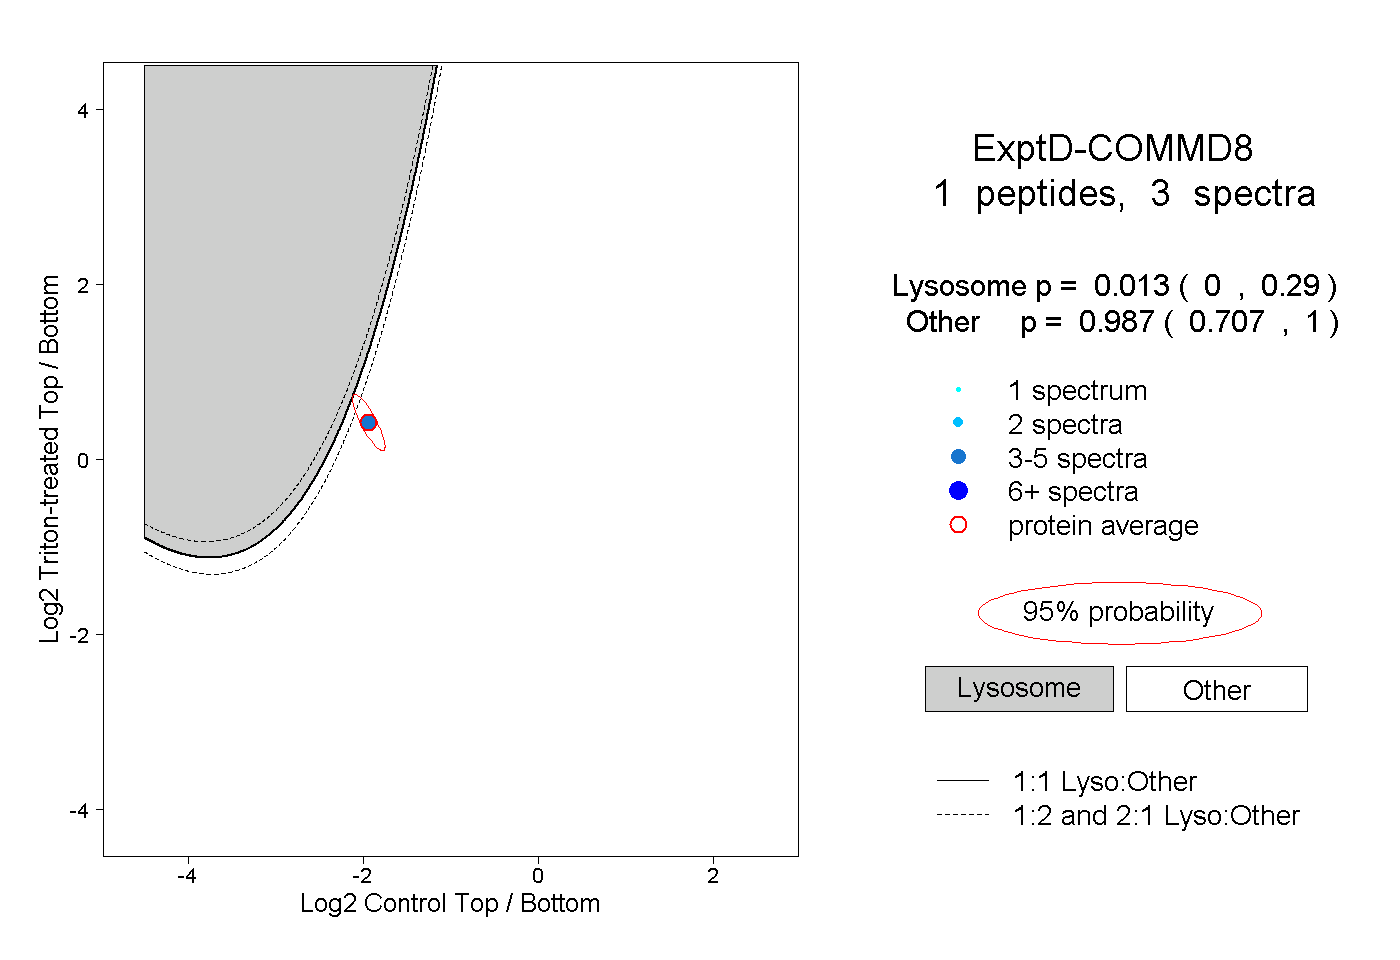
0.000 | 0.290
0.707 | 1.000