 2
2peptides
spectra
0.000 | 0.000
0.872 | 1.000
0.000 | 0.000
0.000 | 0.047
0.000 | 0.000
0.000 | 0.066
0.000 | 0.000
0.000 | 0.000
7peptides
spectra
0.000 | 0.000
1.000 | 1.000
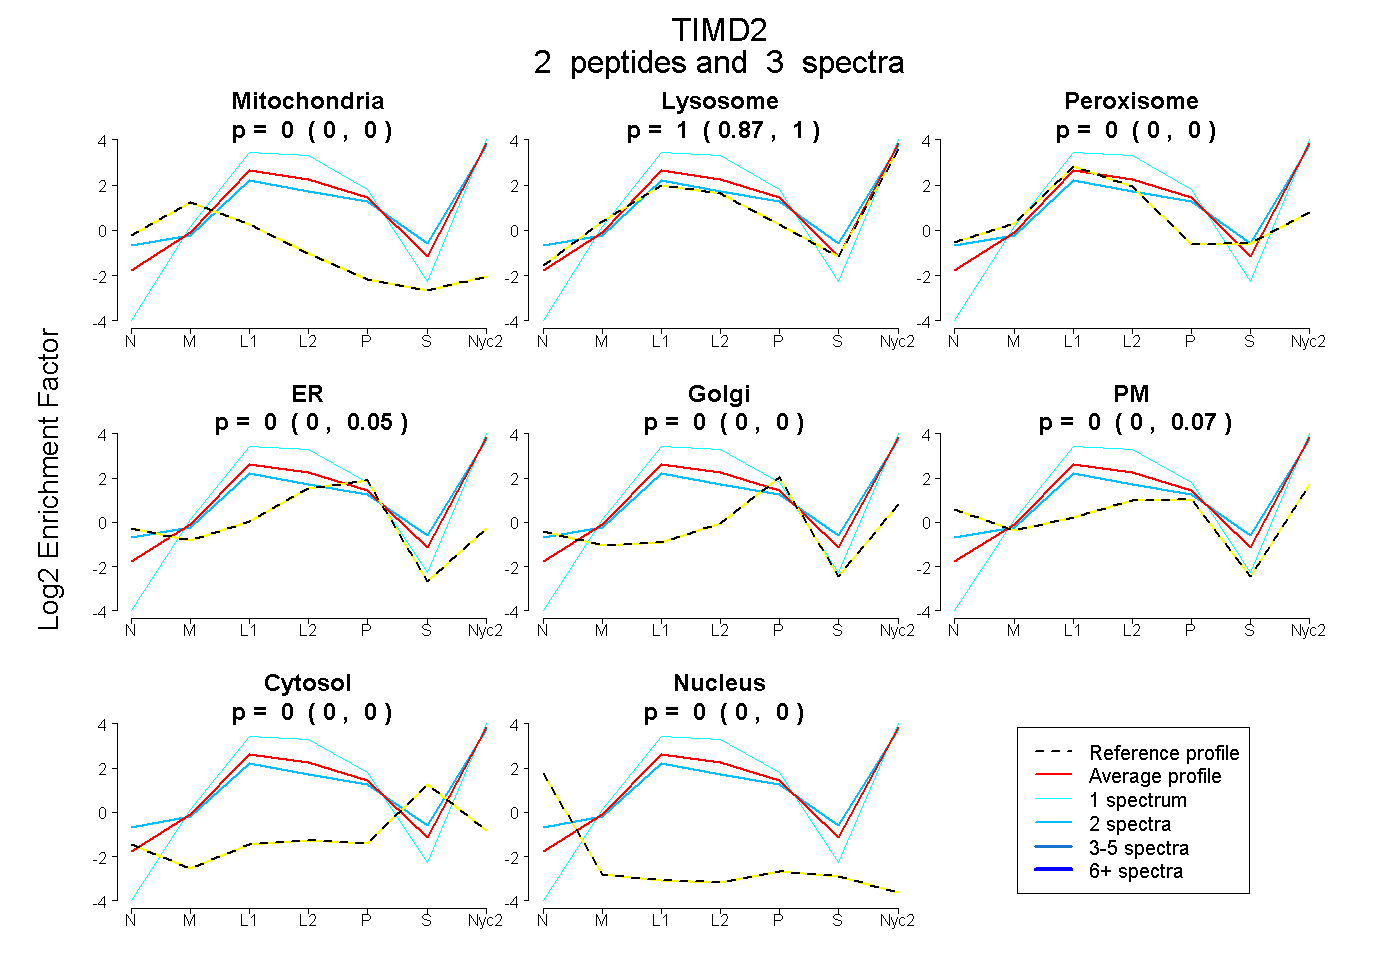
| Plot | Mito | Lyso | Perox | ER | Golgi | PM | Cytosol | Nucleus | |||||
| Expt A |
2 peptides |
3 spectra |
|
0.000 0.000 | 0.000 |
1.000 0.872 | 1.000 |
0.000 0.000 | 0.000 |
0.000 0.000 | 0.047 |
0.000 0.000 | 0.000 |
0.000 0.000 | 0.066 |
0.000 0.000 | 0.000 |
0.000 0.000 | 0.000 |
||
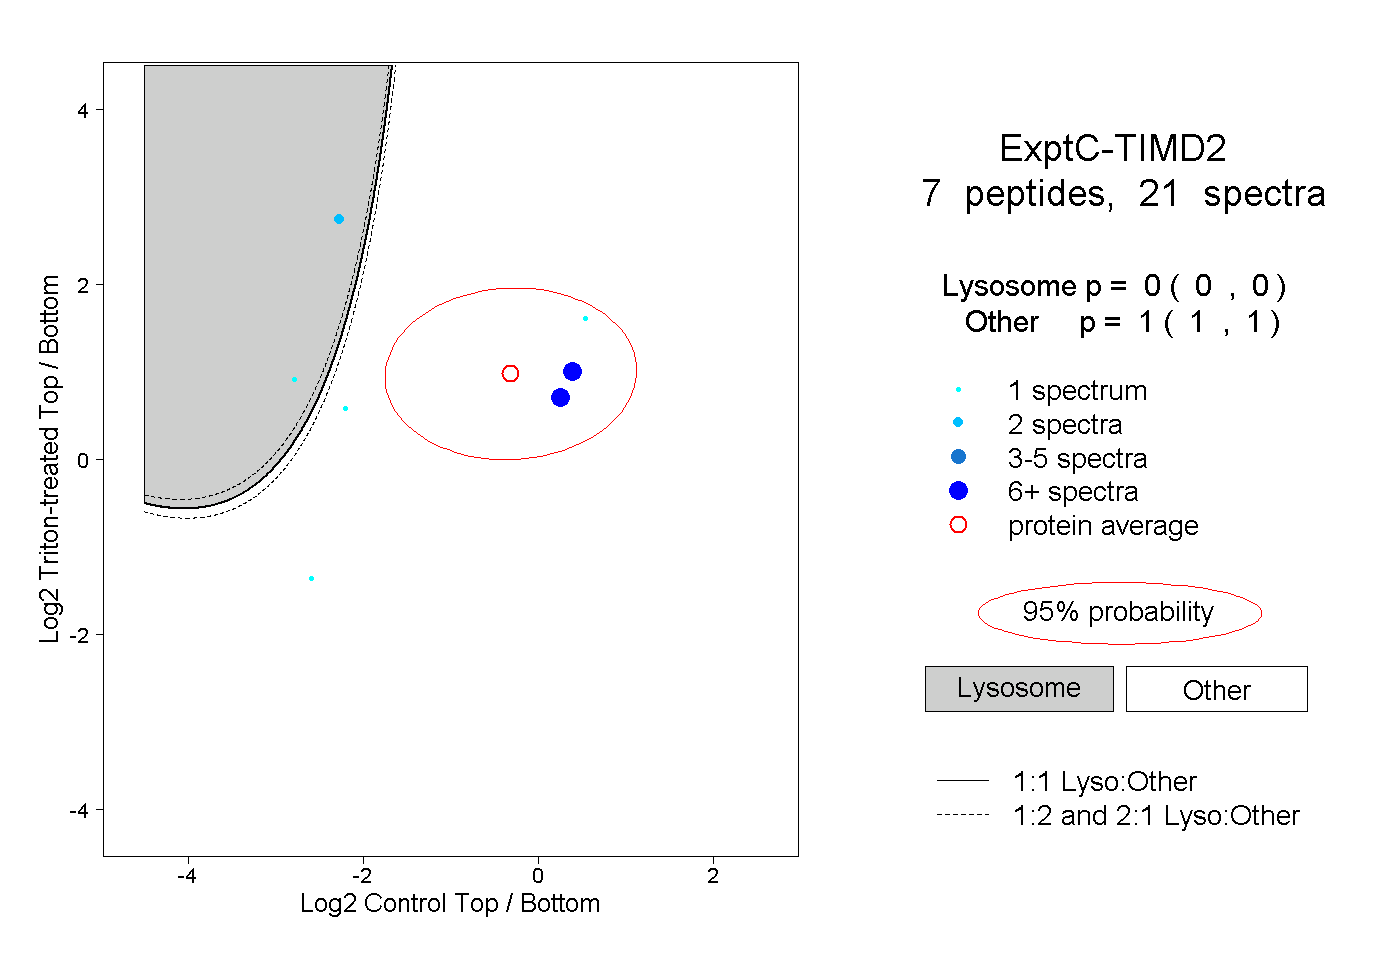
| Plot | Lyso | Other | |||||||||||
| Expt C |
7 peptides |
21 spectra |
|
0.000 0.000 | 0.000 |
1.000 1.000 | 1.000 |
| 2 spectra, SLIWTNGYK | 1.000 | 0.000 | ||||||||
| 1 spectrum, VSTSTPPTPEQTQTHR | 0.000 | 1.000 | ||||||||
| 9 spectra, VVEQAR | 0.000 | 1.000 | ||||||||
| 1 spectrum, FVAFPVSK | 0.000 | 1.000 | ||||||||
| 6 spectra, IGASQNK | 0.000 | 1.000 | ||||||||
| 1 spectrum, SSYCTR | 0.998 | 0.002 | ||||||||
| 1 spectrum, DEMVPTCWGR | 0.002 | 0.998 |