19
19peptides
spectra
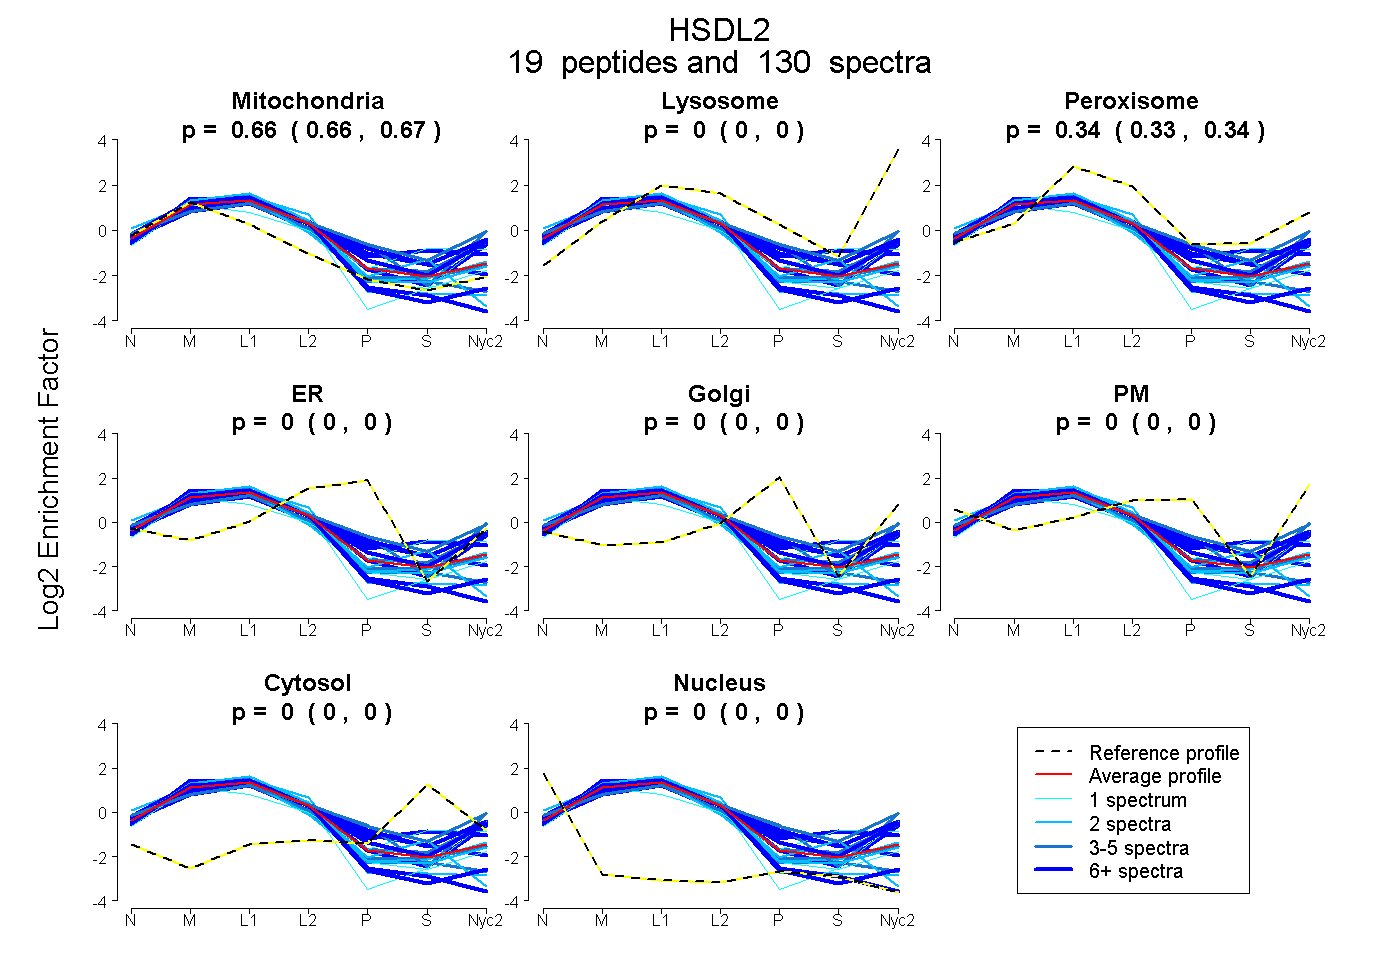
0.656 | 0.666
0.000 | 0.000
0.333 | 0.343
0.000 | 0.000
0.000 | 0.000
0.000 | 0.000
0.000 | 0.000
0.000 | 0.000
8peptides
spectra
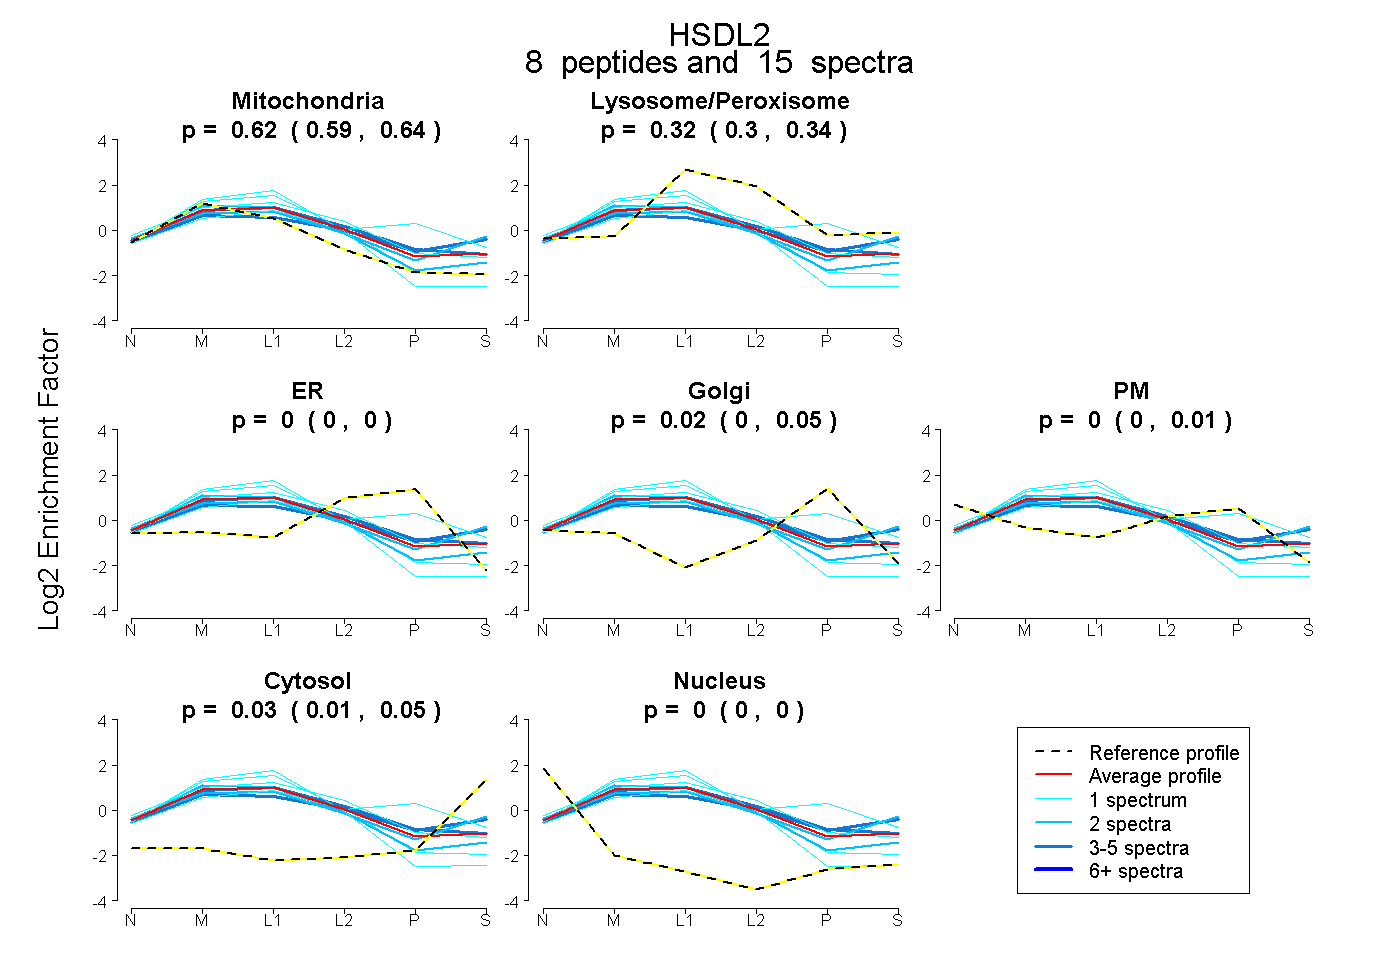
0.593 | 0.642
0.305 | 0.336
0.000 | 0.000
0.000 | 0.045
0.000 | 0.011
0.013 | 0.050
0.000 | 0.000