 4
4peptides
spectra
0.000 | 0.073
0.000 | 0.190
0.000 | 0.172
0.000 | 0.000
0.328 | 0.517
0.000 | 0.072
0.293 | 0.385
0.000 | 0.000
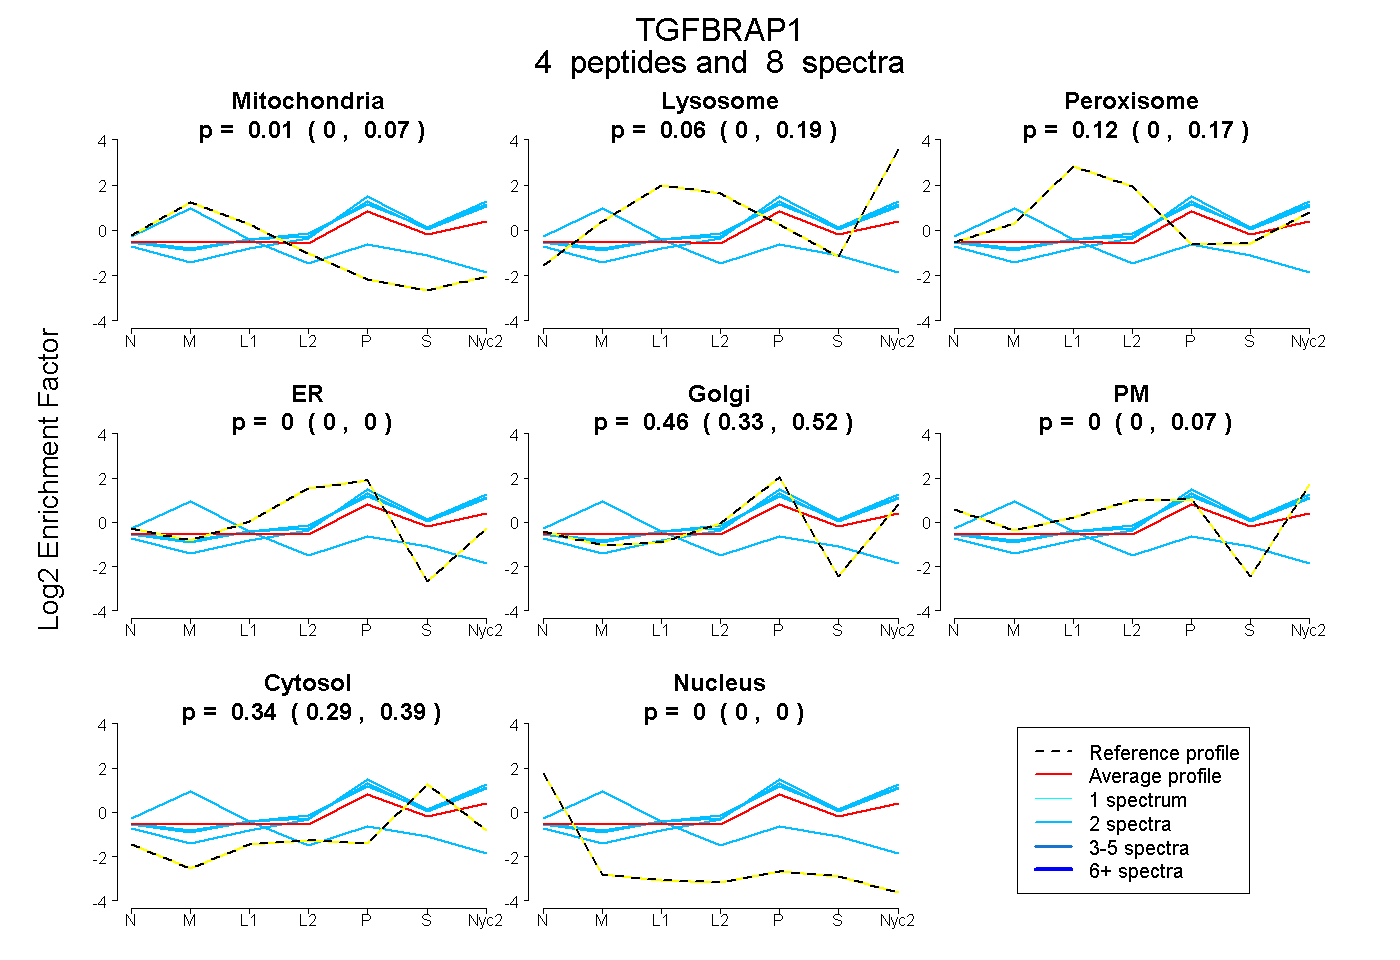
| Plot | Mito | Lyso | Perox | ER | Golgi | PM | Cytosol | Nucleus | |||||
| Expt A |
4 peptides |
8 spectra |
|
0.014 0.000 | 0.073 |
0.062 0.000 | 0.190 |
0.116 0.000 | 0.172 |
0.000 0.000 | 0.000 |
0.464 0.328 | 0.517 |
0.000 0.000 | 0.072 |
0.343 0.293 | 0.385 |
0.000 0.000 | 0.000 |
| 2 spectra, GVYILVPLPLEK | 0.655 | 0.000 | 0.000 | 0.000 | 0.140 | 0.000 | 0.205 | 0.000 | ||
| 2 spectra, AFTLVSAVER | 0.000 | 0.170 | 0.000 | 0.000 | 0.485 | 0.000 | 0.345 | 0.000 | ||
| 2 spectra, QTLPFK | 0.000 | 0.259 | 0.000 | 0.000 | 0.405 | 0.000 | 0.336 | 0.000 | ||
| 2 spectra, QIQDLLANR | 0.000 | 0.226 | 0.000 | 0.000 | 0.450 | 0.000 | 0.324 | 0.000 |
| Plot | Lyso | Other | |||||||||||
| Expt C |
2 peptides |
4 spectra |
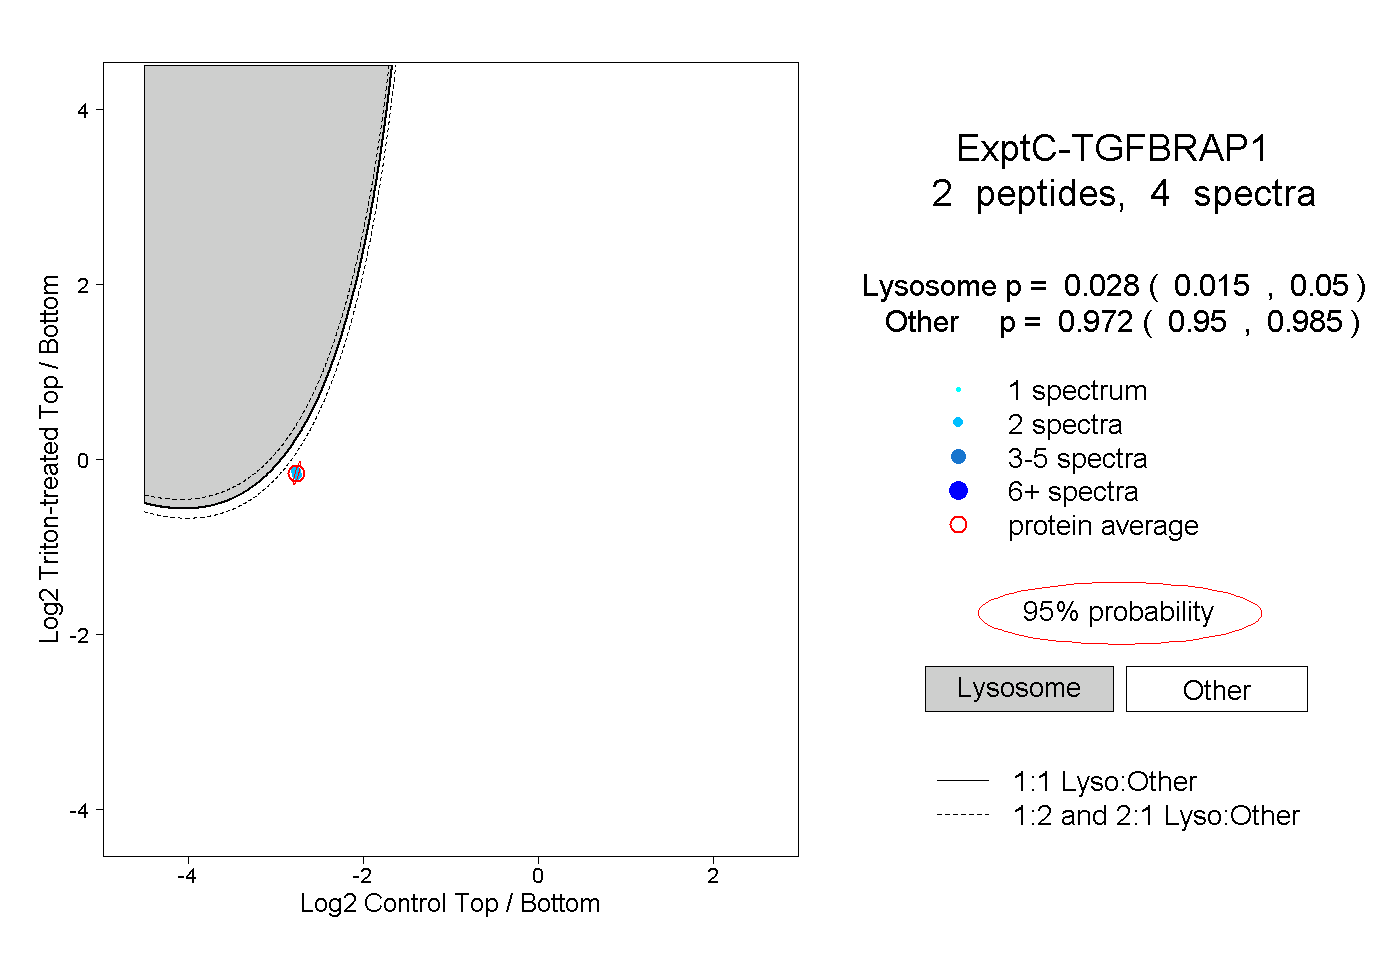 |
0.028 0.015 | 0.050 |
0.972 0.950 | 0.985 |