 4
4peptides
spectra
0.000 | 0.000
0.000 | 0.000
0.000 | 0.013
0.003 | 0.158
0.000 | 0.000
0.330 | 0.509
0.456 | 0.491
0.000 | 0.023
5peptides
spectra
0.000 | 0.000
1.000 | 1.000
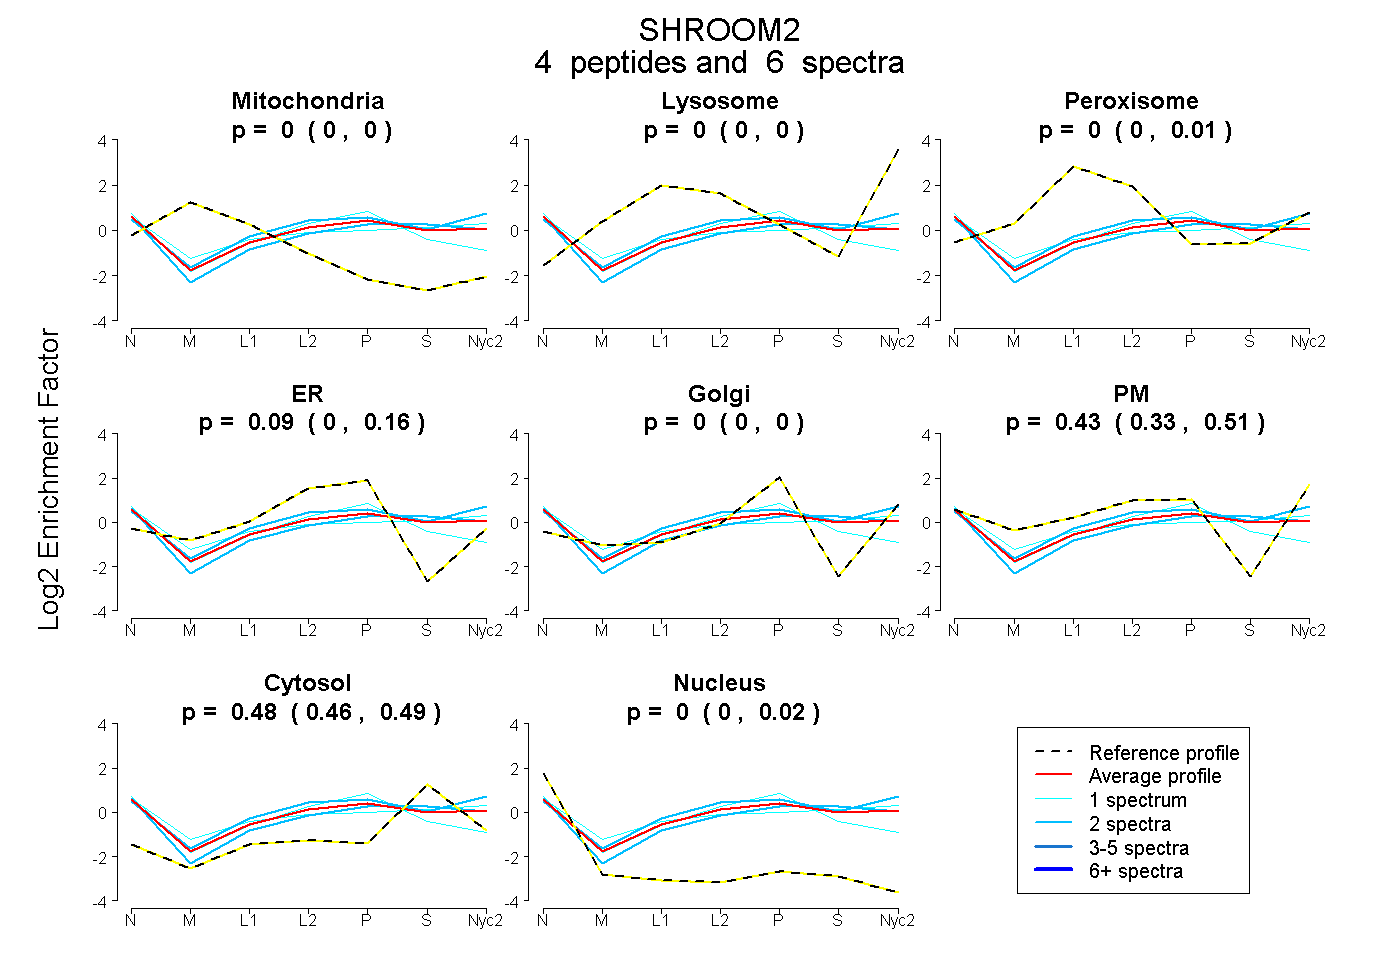
| Plot | Mito | Lyso | Perox | ER | Golgi | PM | Cytosol | Nucleus | |||||
| Expt A |
4 peptides |
6 spectra |
|
0.000 0.000 | 0.000 |
0.000 0.000 | 0.000 |
0.000 0.000 | 0.013 |
0.086 0.003 | 0.158 |
0.000 0.000 | 0.000 |
0.432 0.330 | 0.509 |
0.478 0.456 | 0.491 |
0.005 0.000 | 0.023 |
||
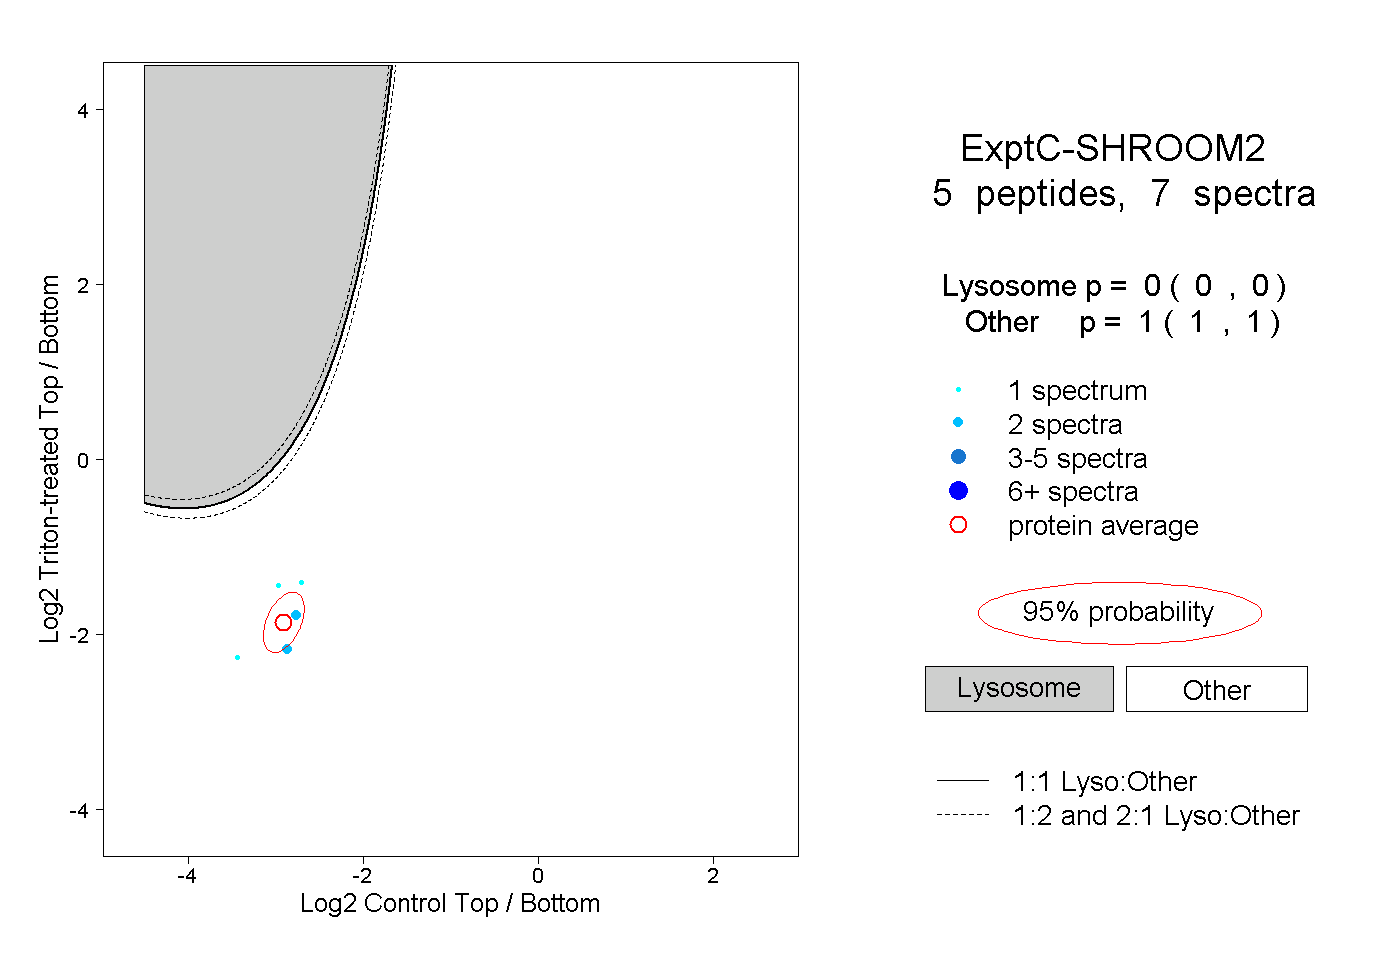
| Plot | Lyso | Other | |||||||||||
| Expt C |
5 peptides |
7 spectra |
|
0.000 0.000 | 0.000 |
1.000 1.000 | 1.000 |