 2
2peptides
spectra
NA | NA
NA | NA
NA | NA
NA | NA
NA | NA
NA | NA
NA | NA
NA | NA
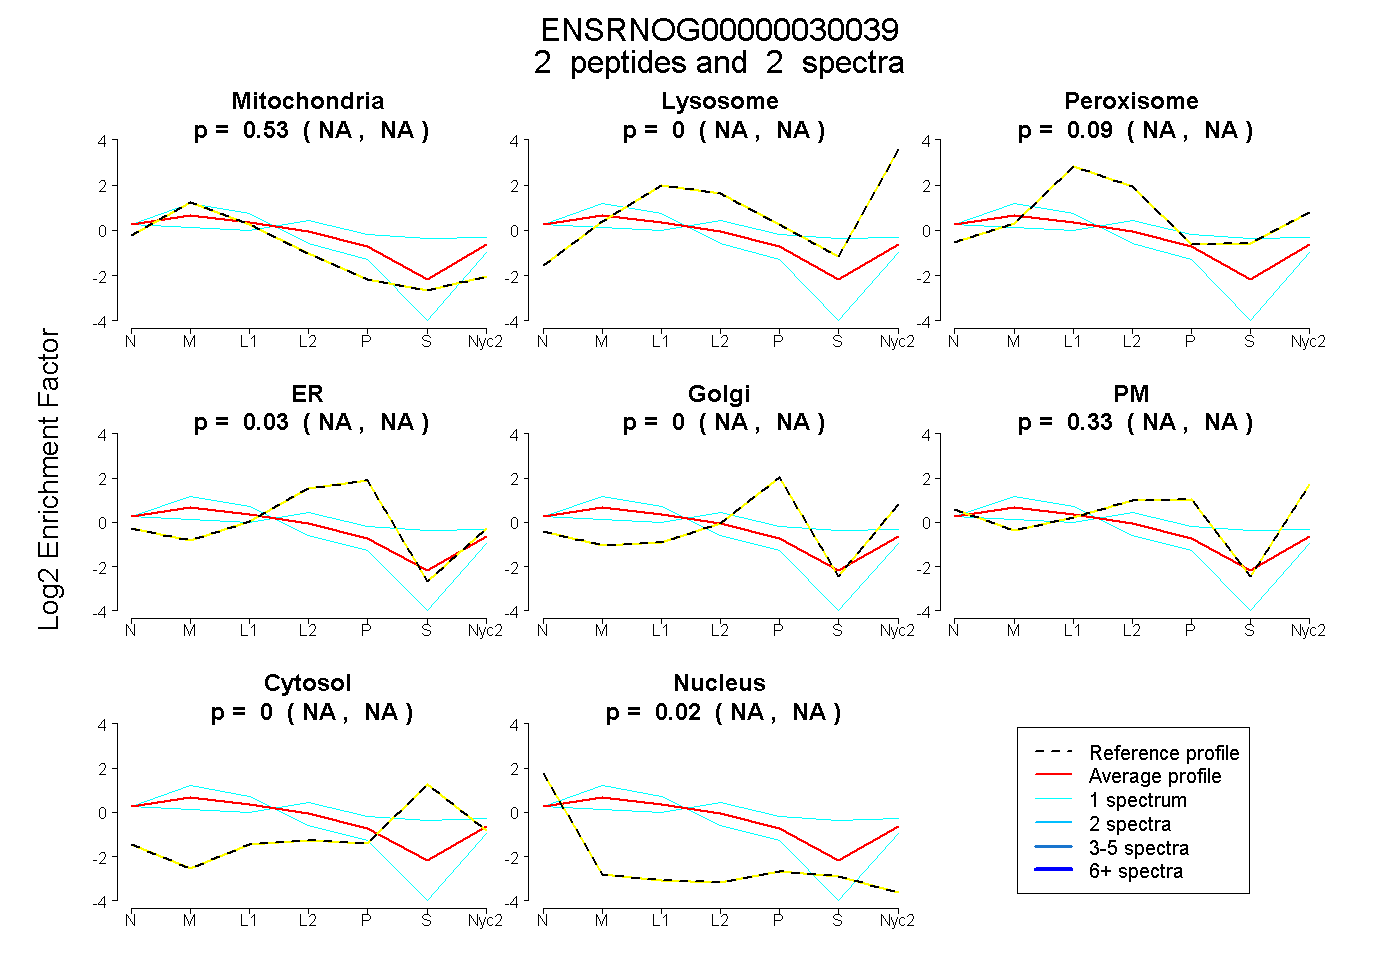
| Plot | Mito | Lyso | Perox | ER | Golgi | PM | Cytosol | Nucleus | |||||
| Expt A |
2 peptides |
2 spectra |
|
0.532 NA | NA |
0.000 NA | NA |
0.091 NA | NA |
0.031 NA | NA |
0.000 NA | NA |
0.326 NA | NA |
0.002 NA | NA |
0.018 NA | NA |
| 1 spectrum, LDSGEEVDIEK | 0.185 | 0.000 | 0.224 | 0.067 | 0.000 | 0.256 | 0.267 | 0.000 | ||
| 1 spectrum, LLPMIK | 0.748 | 0.000 | 0.000 | 0.000 | 0.000 | 0.252 | 0.000 | 0.000 |