 2
2peptides
spectra
0.000 | 0.000
0.109 | 0.322
0.000 | 0.125
0.000 | 0.000
0.000 | 0.000
0.336 | 0.460
0.280 | 0.359
0.000 | 0.000
4peptides
spectra
0.000 | 0.000
1.000 | 1.000
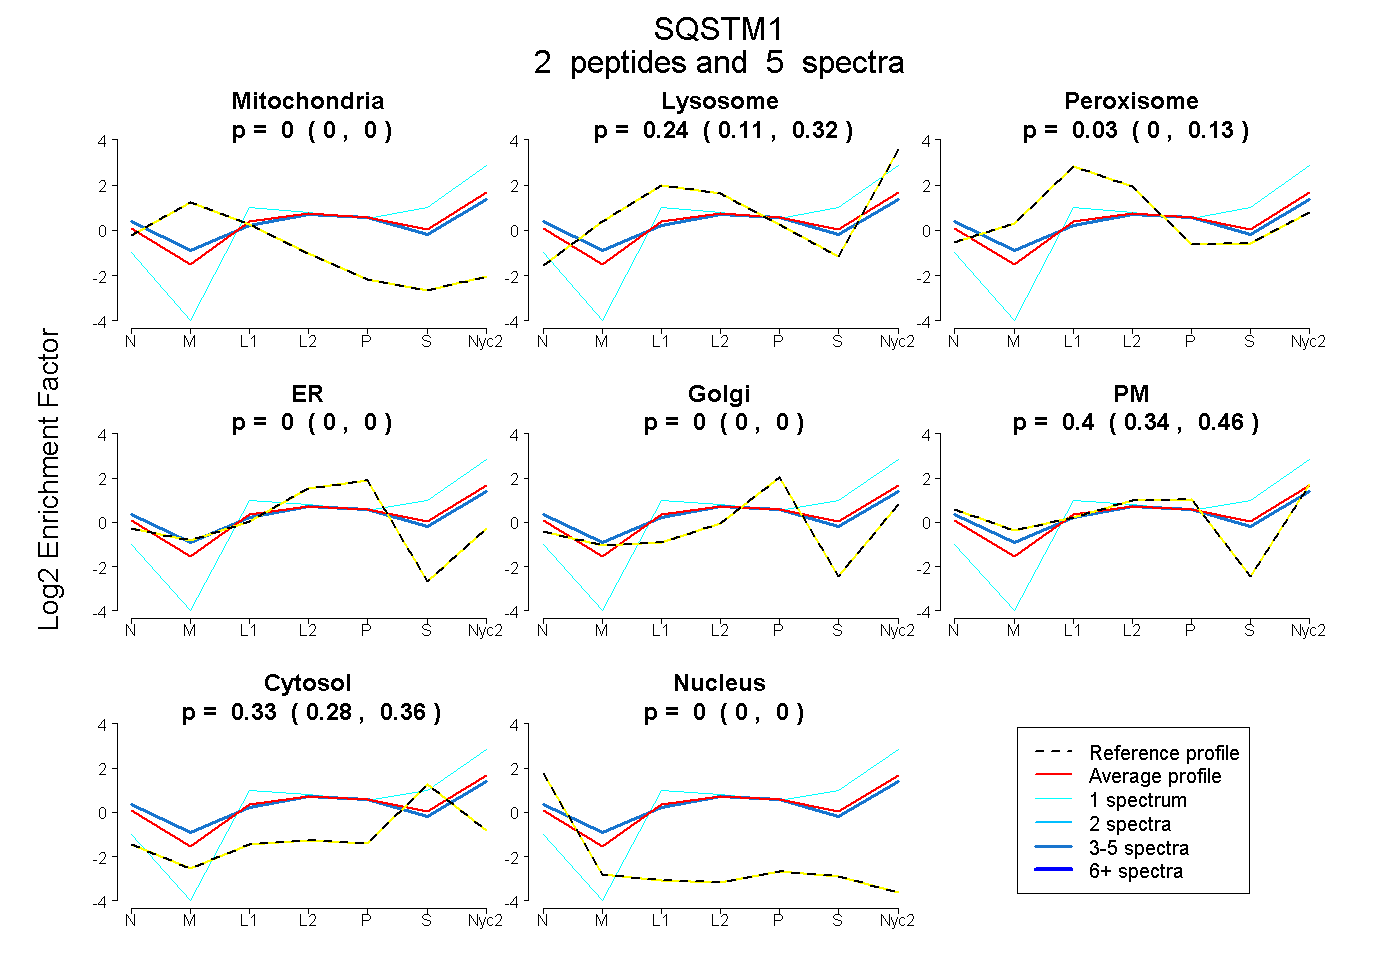
| Plot | Mito | Lyso | Perox | ER | Golgi | PM | Cytosol | Nucleus | |||||
| Expt A |
2 peptides |
5 spectra |
|
0.000 0.000 | 0.000 |
0.238 0.109 | 0.322 |
0.034 0.000 | 0.125 |
0.000 0.000 | 0.000 |
0.000 0.000 | 0.000 |
0.401 0.336 | 0.460 |
0.327 0.280 | 0.359 |
0.000 0.000 | 0.000 |
||
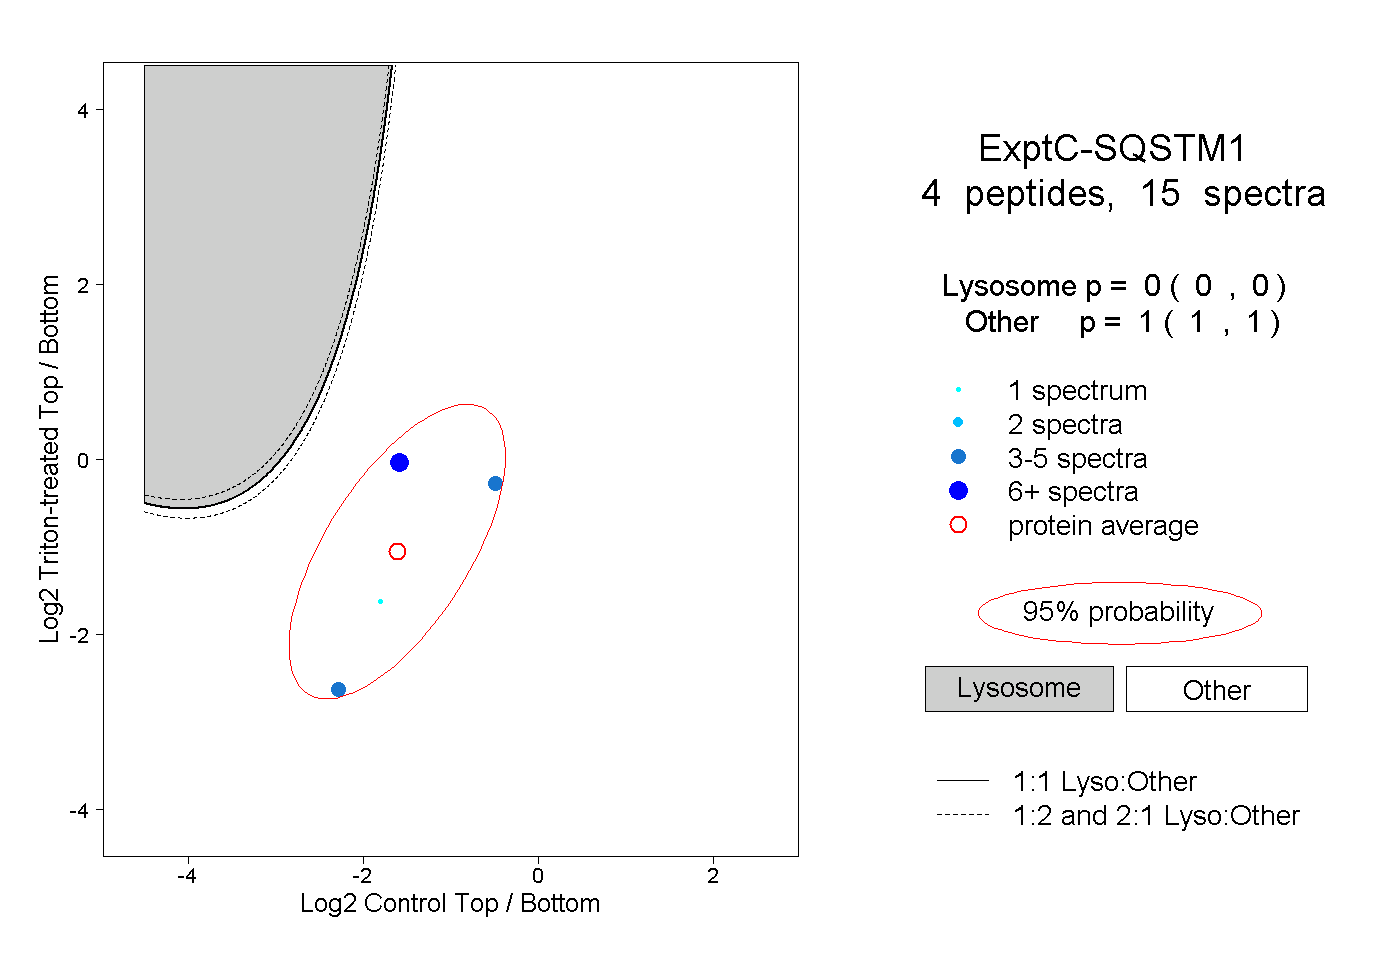
| Plot | Lyso | Other | |||||||||||
| Expt C |
4 peptides |
15 spectra |
|
0.000 0.000 | 0.000 |
1.000 1.000 | 1.000 |