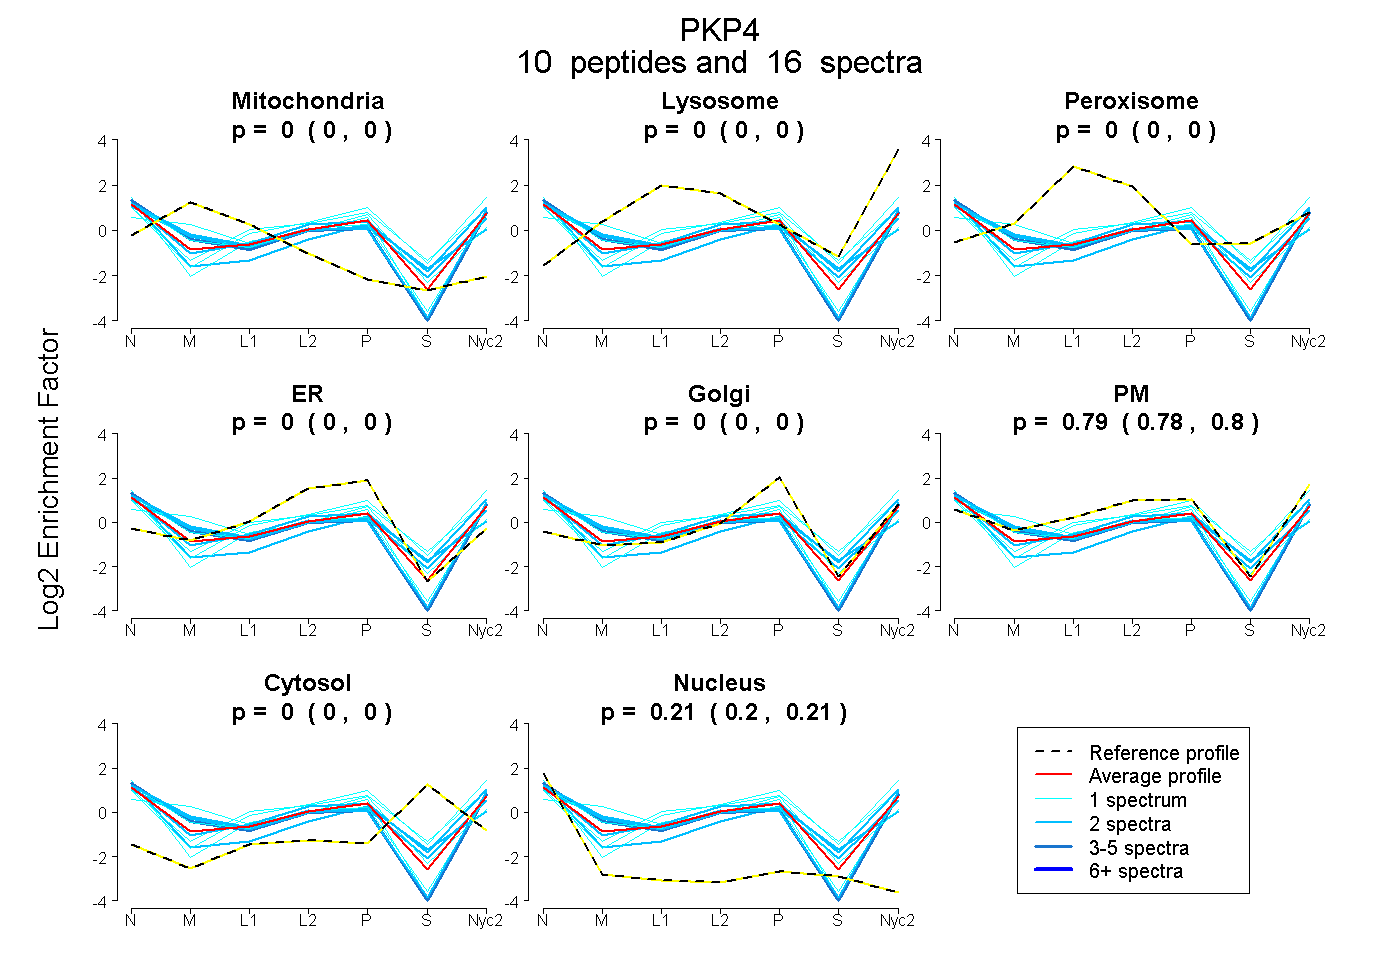
 10
10peptides
spectra
0.000 | 0.000
0.000 | 0.000
0.000 | 0.000
0.000 | 0.000
0.000 | 0.004
0.782 | 0.800
0.000 | 0.000
0.199 | 0.212
9peptides
spectra
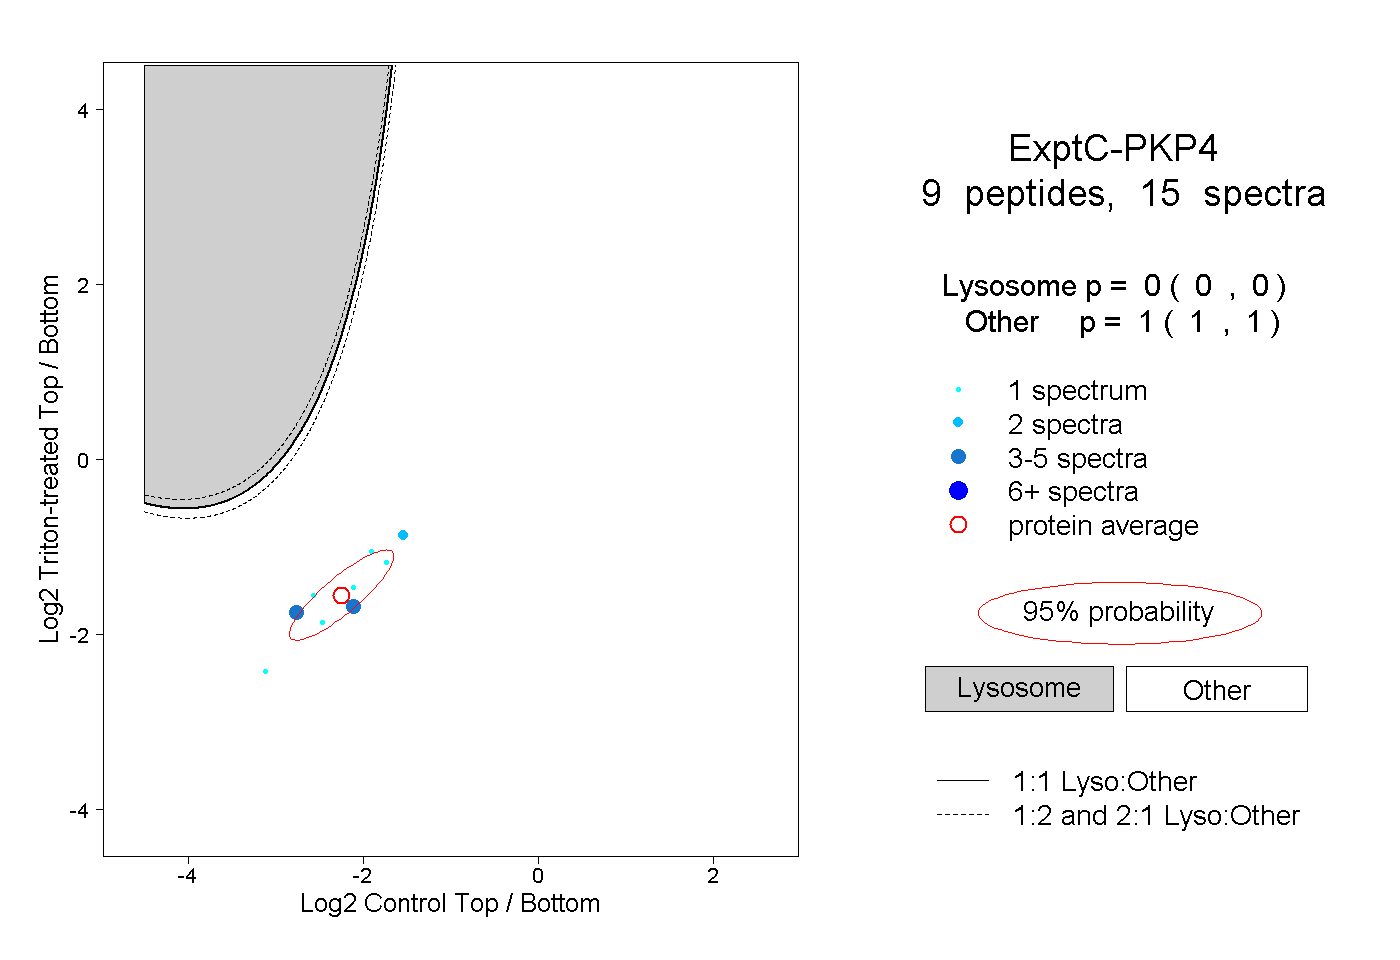
0.000 | 0.000
1.000 | 1.000
| Plot | Mito | Lyso | Perox | ER | Golgi | PM | Cytosol | Nucleus | |||||
| Expt A |
10 peptides |
16 spectra |
|
0.000 0.000 | 0.000 |
0.000 0.000 | 0.000 |
0.000 0.000 | 0.000 |
0.000 0.000 | 0.000 |
0.000 0.000 | 0.004 |
0.793 0.782 | 0.800 |
0.000 0.000 | 0.000 |
0.207 0.199 | 0.212 |
||
| Plot | Lyso | Other | |||||||||||
| Expt C |
9 peptides |
15 spectra |
|
0.000 0.000 | 0.000 |
1.000 1.000 | 1.000 |
| 1 spectrum, STDENK | 0.000 | 1.000 | ||||||||
| 1 spectrum, NLSSAGEEAR | 0.000 | 1.000 | ||||||||
| 1 spectrum, VLEVQK | 0.000 | 1.000 | ||||||||
| 1 spectrum, FAAYIR | 0.000 | 1.000 | ||||||||
| 2 spectra, GLPILVELLR | 0.000 | 1.000 | ||||||||
| 3 spectra, STLTYQR | 0.000 | 1.000 | ||||||||
| 4 spectra, STDVPNTGVSKPR | 0.000 | 1.000 | ||||||||
| 1 spectrum, LELEVPQAR | 0.000 | 1.000 | ||||||||
| 1 spectrum, VQECSYNR | 0.000 | 1.000 |