 10
10peptides
spectra
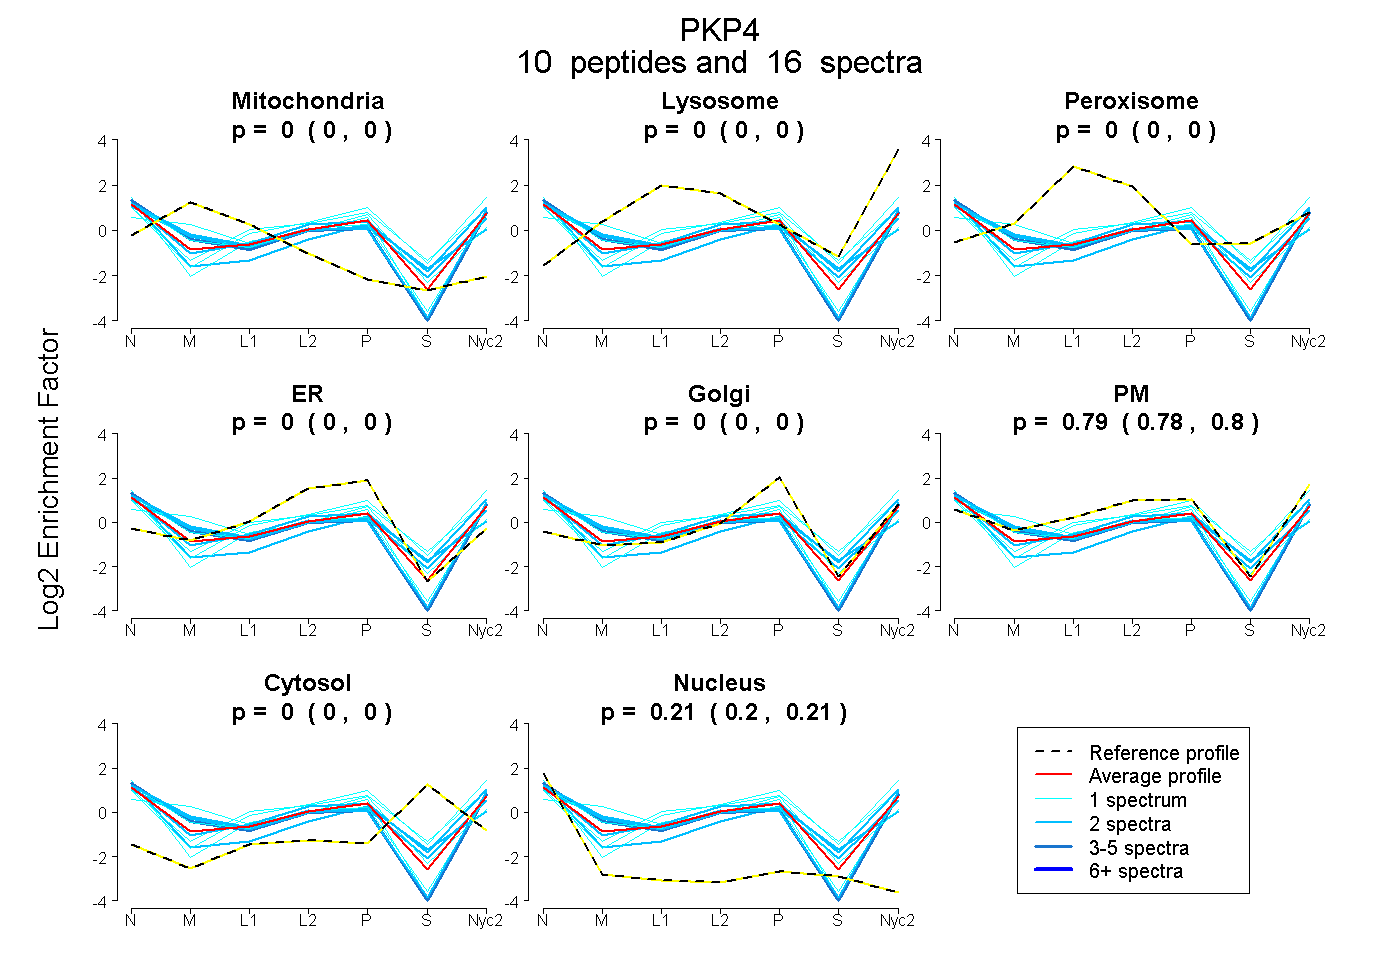
0.000 | 0.000
0.000 | 0.000
0.000 | 0.000
0.000 | 0.000
0.000 | 0.004
0.782 | 0.800
0.000 | 0.000
0.199 | 0.212
| Plot | Mito | Lyso | Perox | ER | Golgi | PM | Cytosol | Nucleus | |||||
| Expt A |
10 peptides |
16 spectra |
|
0.000 0.000 | 0.000 |
0.000 0.000 | 0.000 |
0.000 0.000 | 0.000 |
0.000 0.000 | 0.000 |
0.000 0.000 | 0.004 |
0.793 0.782 | 0.800 |
0.000 0.000 | 0.000 |
0.207 0.199 | 0.212 |
| 2 spectra, VVSSVATALR | 0.066 | 0.000 | 0.000 | 0.000 | 0.000 | 0.763 | 0.000 | 0.171 | ||
| 1 spectrum, AQSPSYVTSTGVSPSR | 0.000 | 0.000 | 0.000 | 0.000 | 0.021 | 0.737 | 0.000 | 0.243 | ||
| 1 spectrum, VGSPLTLTDAQTR | 0.000 | 0.000 | 0.000 | 0.000 | 0.000 | 0.768 | 0.187 | 0.045 | ||
| 2 spectra, AASPYSQRPASPTAVR | 0.000 | 0.000 | 0.000 | 0.000 | 0.104 | 0.516 | 0.106 | 0.274 | ||
| 1 spectrum, AEGQTLVQPSVANR | 0.000 | 0.000 | 0.000 | 0.000 | 0.028 | 0.782 | 0.171 | 0.018 | ||
| 3 spectra, GLPILVELLR | 0.009 | 0.000 | 0.000 | 0.000 | 0.000 | 0.768 | 0.000 | 0.223 | ||
| 2 spectra, VSSVPSR | 0.000 | 0.000 | 0.000 | 0.000 | 0.000 | 0.780 | 0.088 | 0.132 | ||
| 1 spectrum, STDVPNTGVSKPR | 0.252 | 0.000 | 0.000 | 0.000 | 0.312 | 0.399 | 0.000 | 0.038 | ||
| 2 spectra, HLVDLLDHR | 0.072 | 0.000 | 0.000 | 0.000 | 0.000 | 0.730 | 0.026 | 0.171 | ||
| 1 spectrum, LELEVPQAR | 0.008 | 0.000 | 0.000 | 0.000 | 0.000 | 0.782 | 0.000 | 0.210 |
| Plot | Lyso | Other | |||||||||||
| Expt C |
9 peptides |
15 spectra |
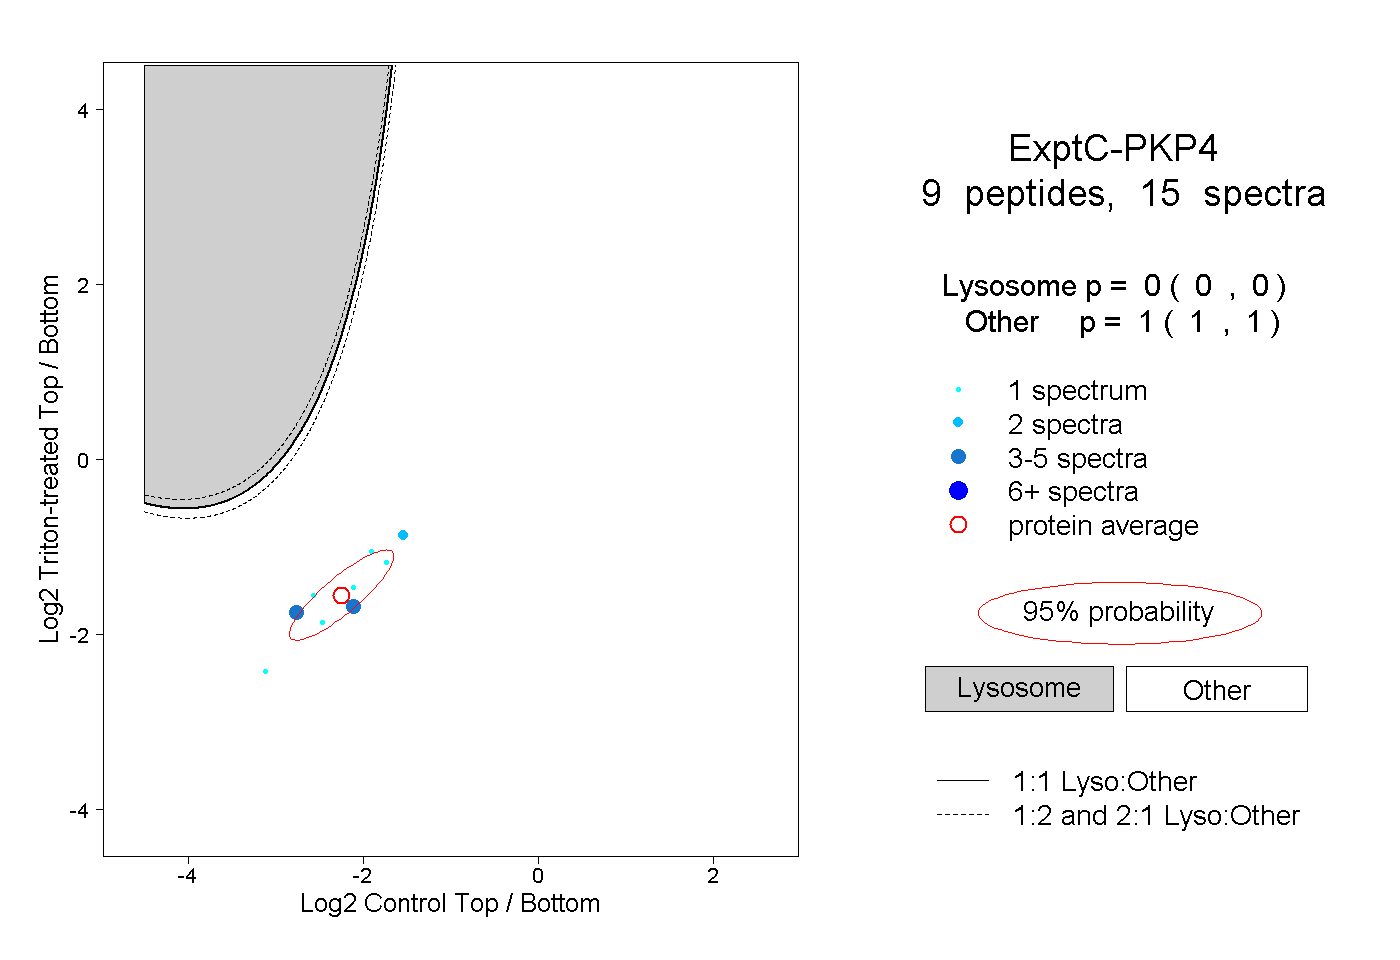 |
0.000 0.000 | 0.000 |
1.000 1.000 | 1.000 |