 3
3peptides
spectra
0.000 | 0.294
0.000 | 0.000
0.000 | 0.199
0.000 | 0.067
0.000 | 0.109
0.000 | 0.172
0.320 | 0.628
0.063 | 0.321
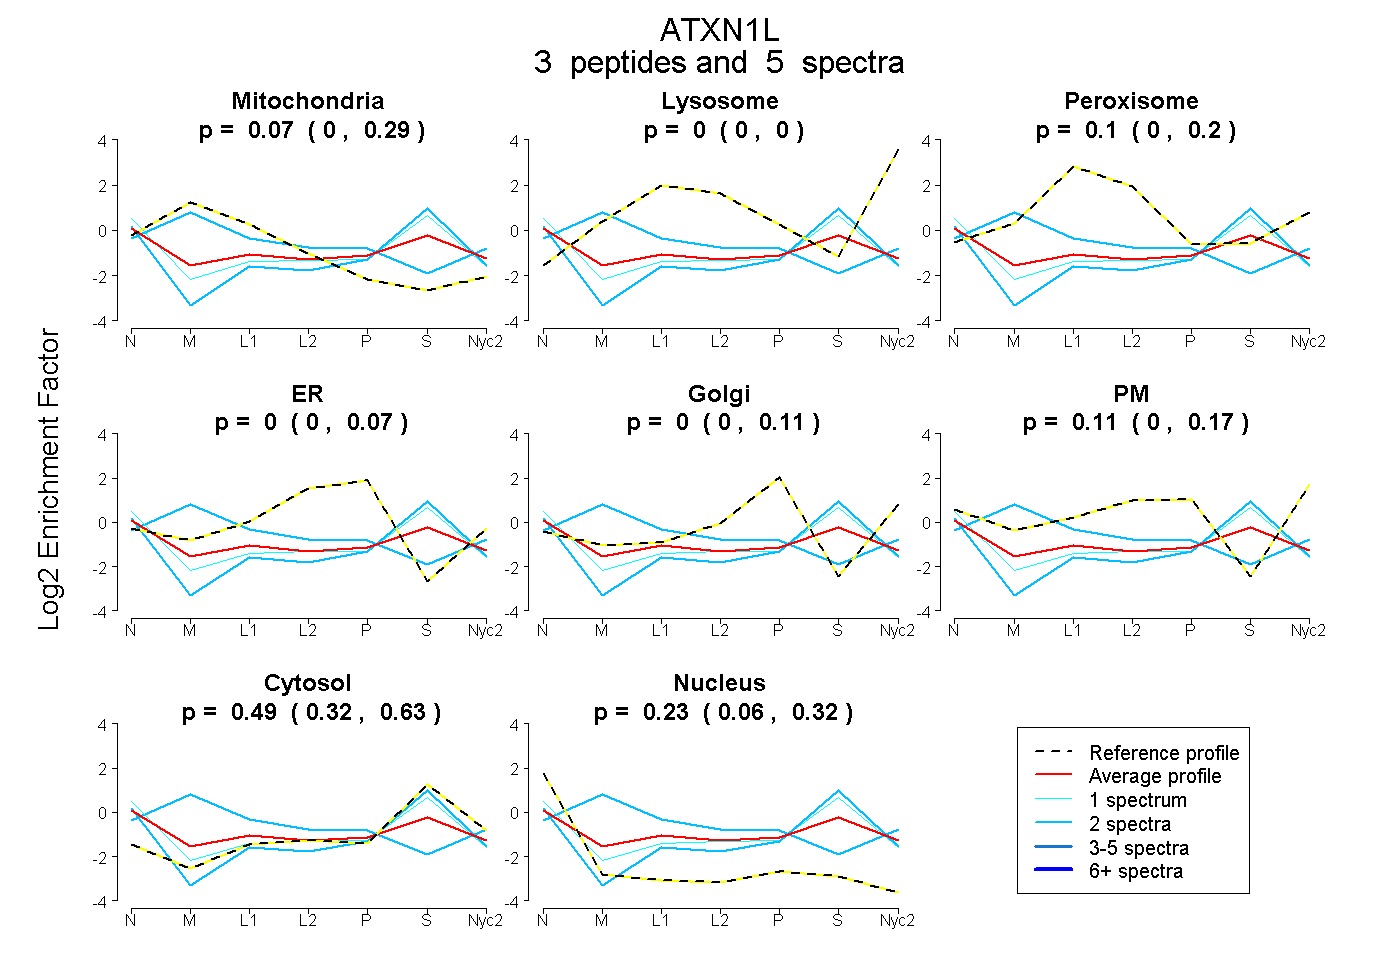
| Plot | Mito | Lyso | Perox | ER | Golgi | PM | Cytosol | Nucleus | |||||
| Expt A |
3 peptides |
5 spectra |
|
0.072 0.000 | 0.294 |
0.000 0.000 | 0.000 |
0.100 0.000 | 0.199 |
0.000 0.000 | 0.067 |
0.000 0.000 | 0.109 |
0.110 0.000 | 0.172 |
0.489 0.320 | 0.628 |
0.230 0.063 | 0.321 |