BCO2
[ENSRNOP00000055965]
Main page
| | | Plot |
Mito |
Lyso |
|
Perox |
ER |
Golgi |
PM |
Cytosol |
Nucleus |
|
| Expt A |
 11
11
peptides |
22
spectra |
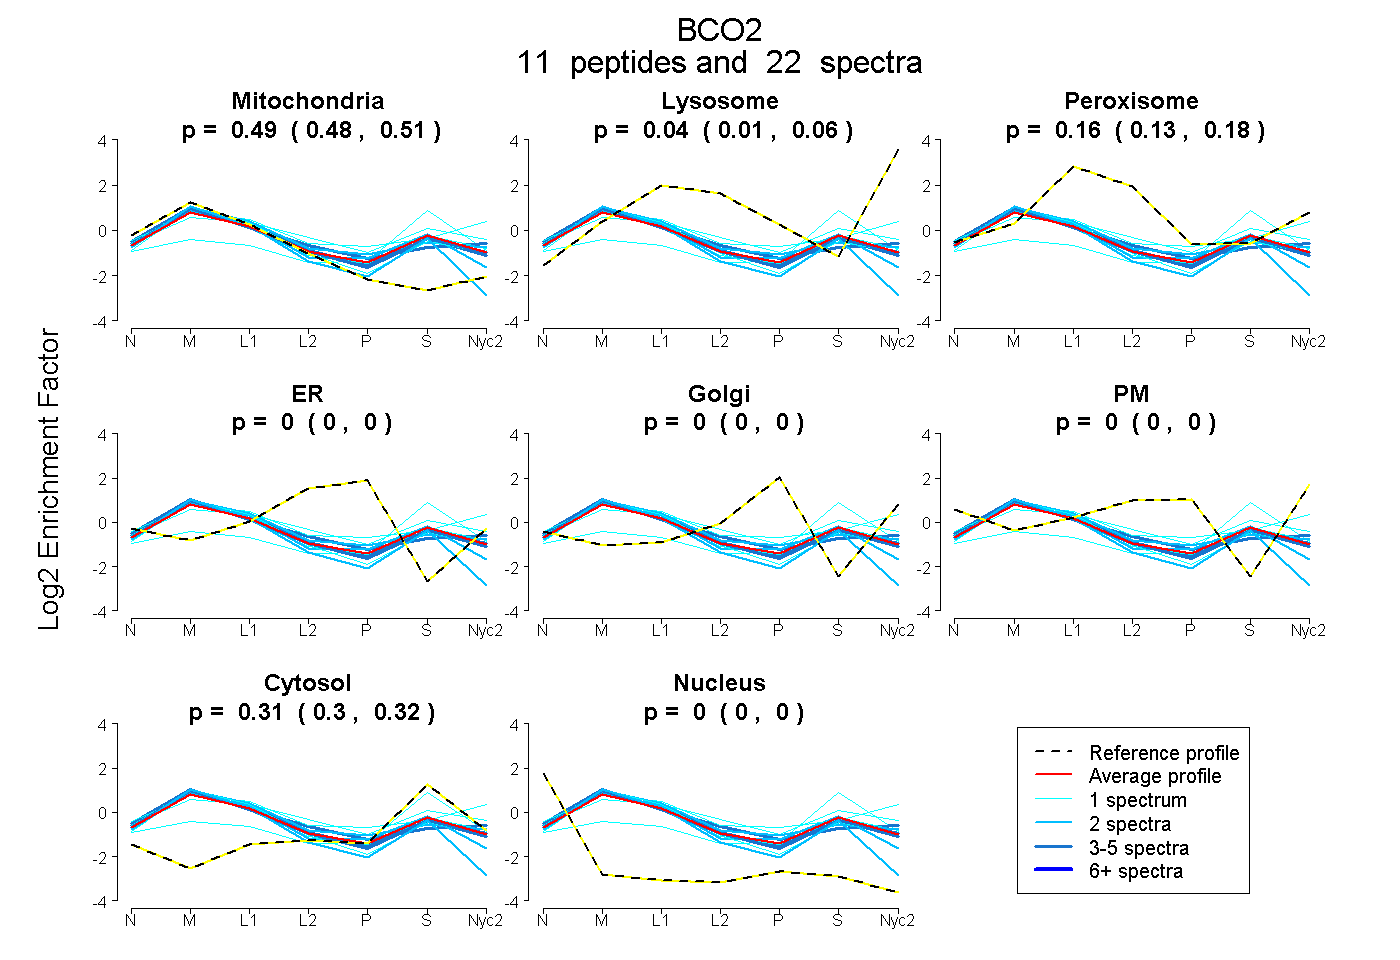 |
0.495
0.483 | 0.505 |
0.036
0.012 | 0.059 |
|
0.158
0.131 | 0.176 |
0.000
0.000 | 0.000 |
0.000
0.000 | 0.000 |
0.000
0.000 | 0.000 |
0.311
0.303 | 0.319 |
0.000
0.000 | 0.000 |
|
| | | Plot |
Mito |
|
Lyso or Perox |
|
ER |
Golgi |
PM |
Cytosol |
Nucleus |
|
| Expt B |
9
peptides |
19
spectra |
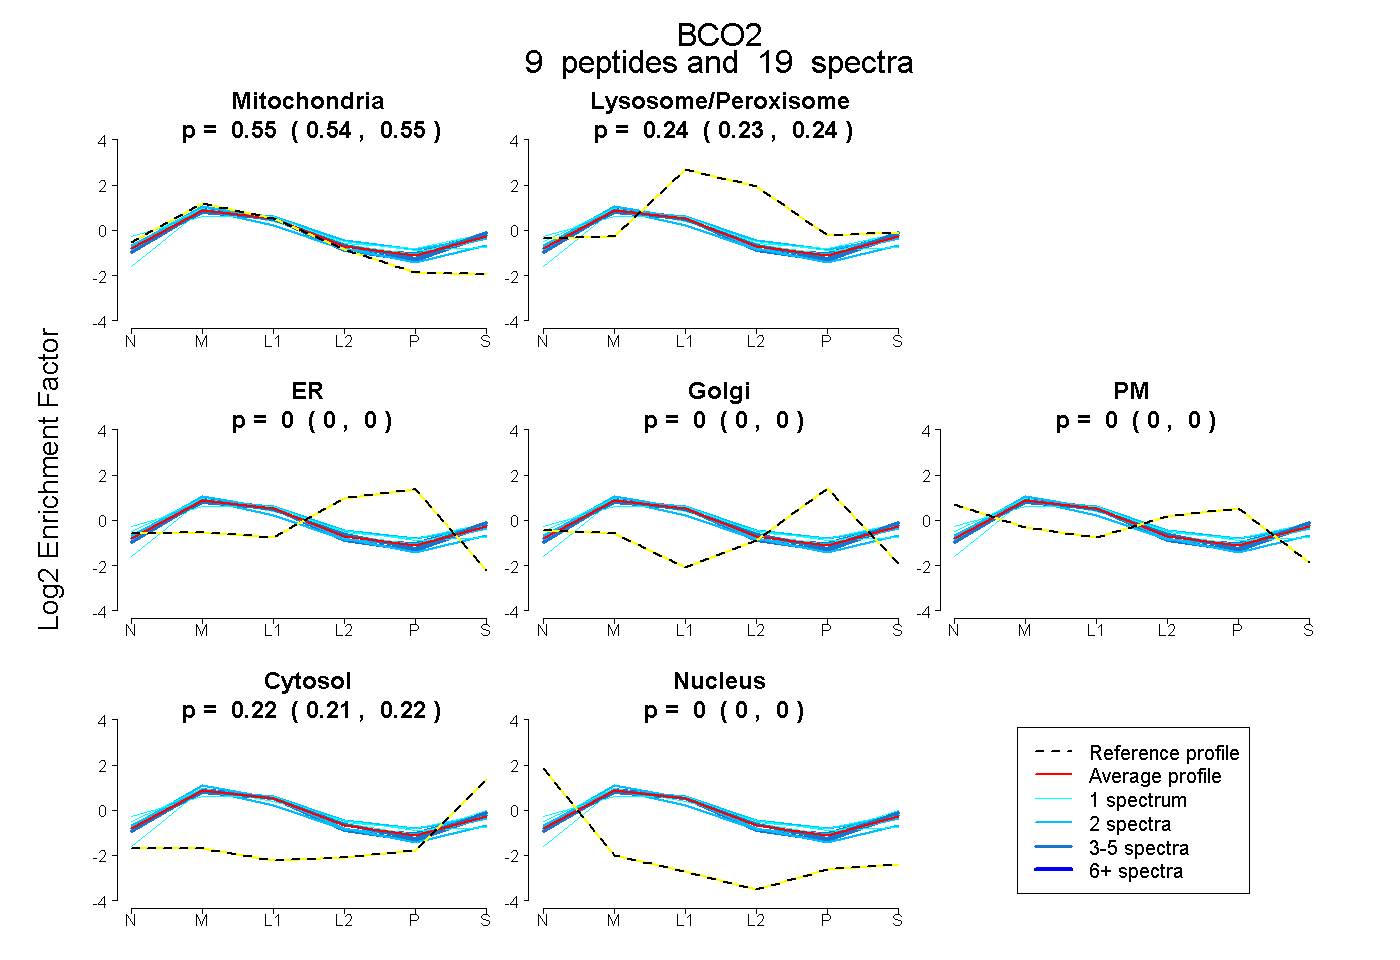 |
0.546
0.539 | 0.553 |
|
0.235
0.229 | 0.240 |
|
0.000
0.000 | 0.000 |
0.000
0.000 | 0.000 |
0.000
0.000 | 0.000 |
0.218
0.213 | 0.222 |
0.000
0.000 | 0.000 |
|
| 2 spectra, GSCYNIIR |
0.563 |
|
0.178 |
|
0.000 |
0.038 |
0.000 |
0.221 |
0.000 |
|
| 3 spectra, AGEELDQVYK |
0.514 |
|
0.239 |
|
0.000 |
0.000 |
0.000 |
0.248 |
0.000 |
|
| 2 spectra, NFTELGR |
0.691 |
|
0.154 |
|
0.000 |
0.000 |
0.000 |
0.156 |
0.000 |
|
| 1 spectrum, NYIVFVEQPLK |
0.416 |
|
0.303 |
|
0.000 |
0.003 |
0.071 |
0.208 |
0.000 |
|
| 1 spectrum, FHVVDK |
0.470 |
|
0.271 |
|
0.000 |
0.000 |
0.000 |
0.259 |
0.000 |
|
| 2 spectra, GHIPEWLNGYLLR |
0.481 |
|
0.297 |
|
0.000 |
0.037 |
0.000 |
0.184 |
0.000 |
|
| 1 spectrum, SLDIYQLQNLR |
0.571 |
|
0.217 |
|
0.000 |
0.108 |
0.000 |
0.104 |
0.000 |
|
| 4 spectra, VDIETLER |
0.518 |
|
0.240 |
|
0.000 |
0.000 |
0.000 |
0.242 |
0.000 |
|
| 3 spectra, AEVPVR |
0.569 |
|
0.202 |
|
0.000 |
0.000 |
0.000 |
0.229 |
0.000 |
|
| | | Plot |
|
Lyso |
|
|
|
|
|
|
|
Other |
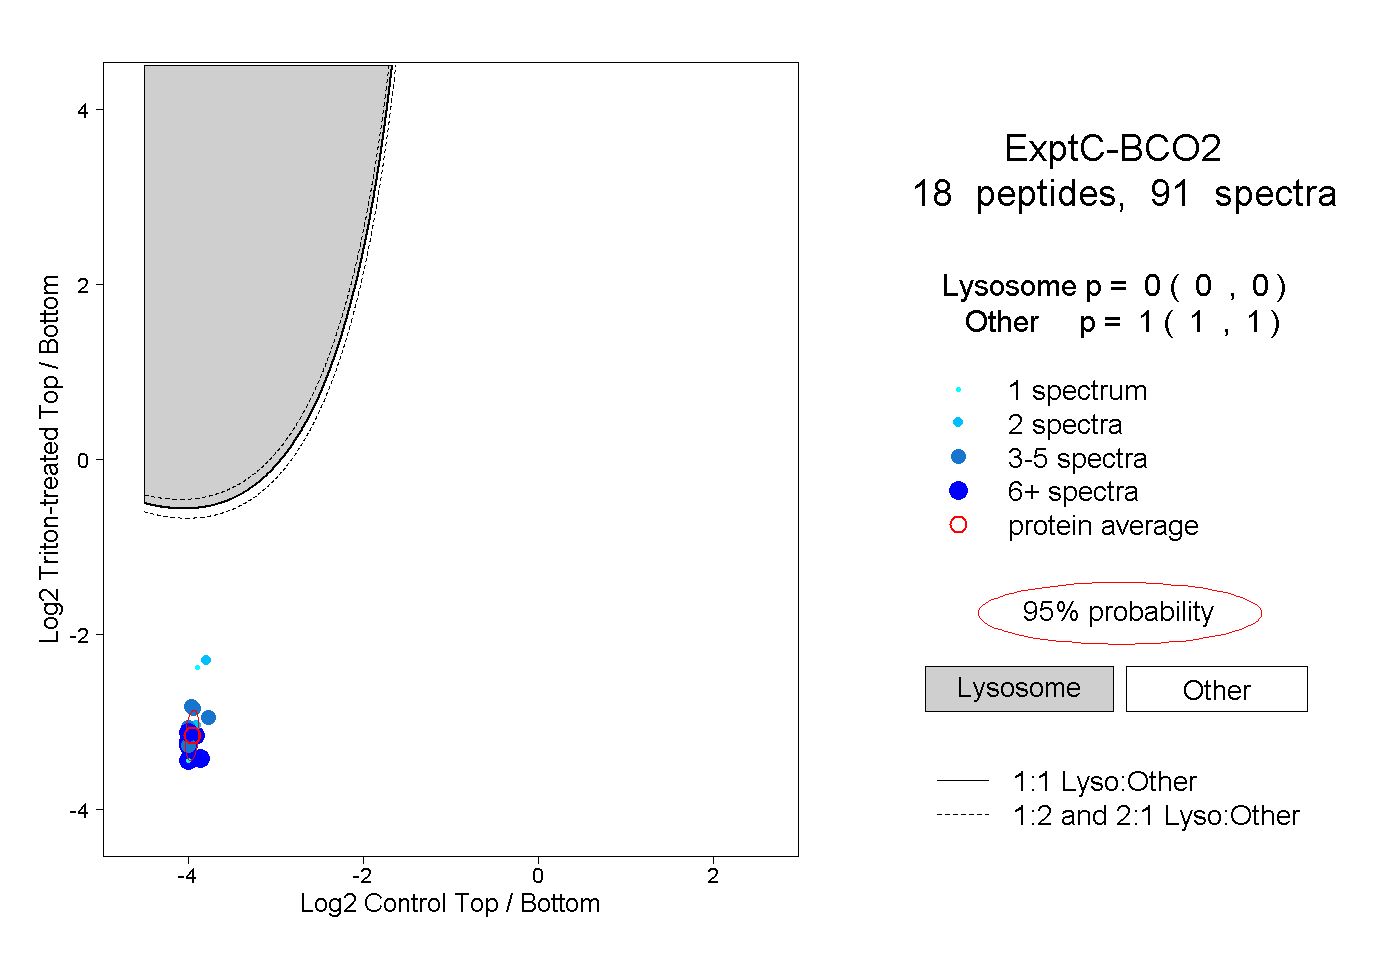
| Expt C |
18
peptides |
91
spectra |
 |
|
0.000
0.000 | 0.000 |
|
|
|
|
|
|
|
1.000
1.000 | 1.000 |
| | | Plot |
|
Lyso |
|
|
|
|
|
|
|
Other |
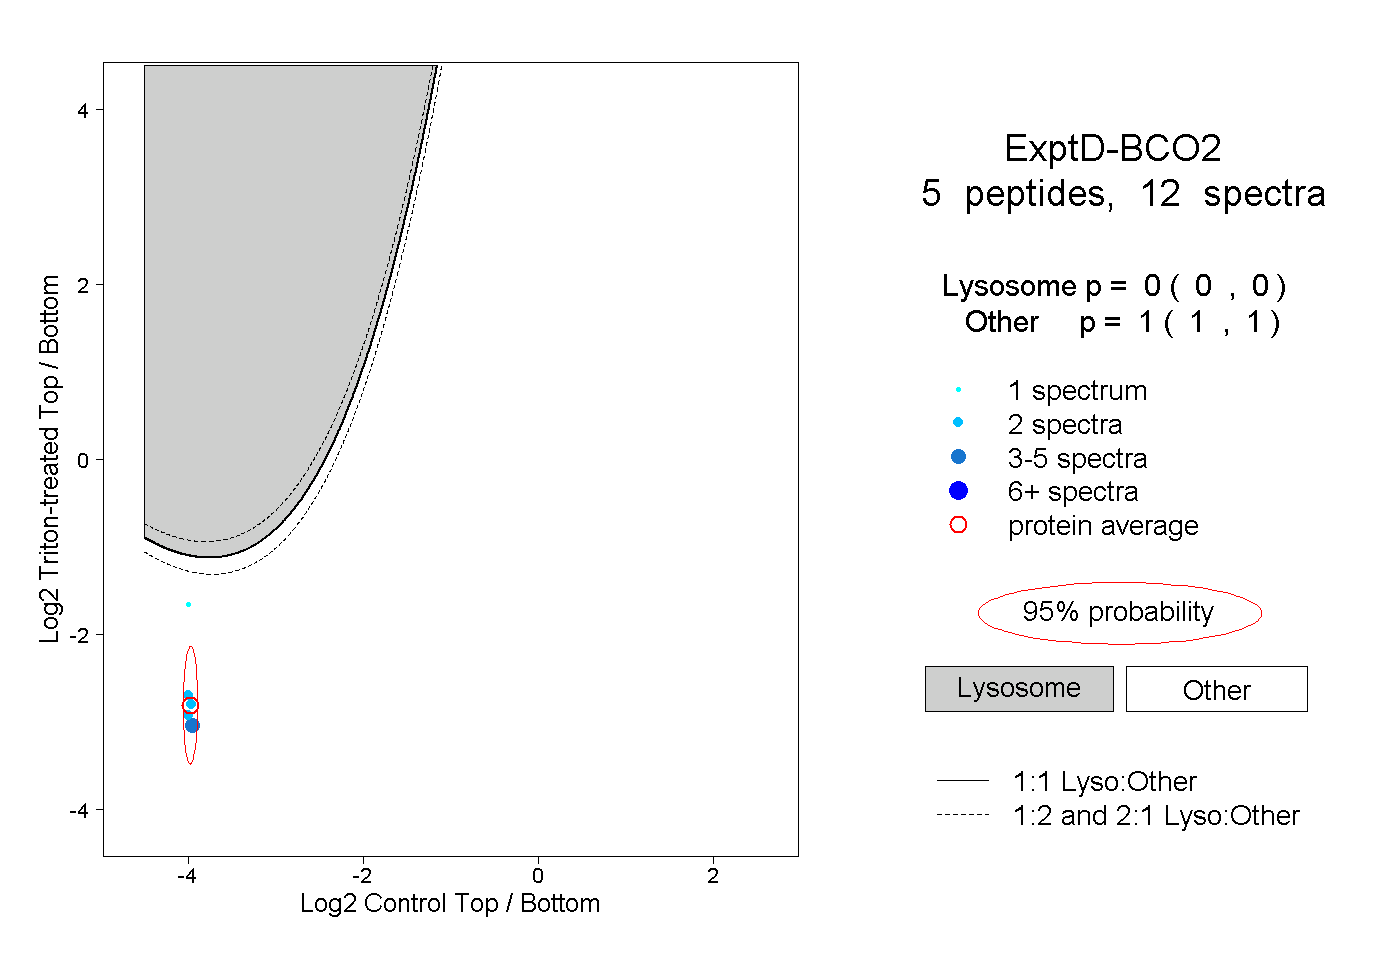
| Expt D |
5
peptides |
12
spectra |
 |
|
0.000
0.000 | 0.000 |
|
|
|
|
|
|
|
1.000
1.000 | 1.000 |