 11
11peptides
spectra
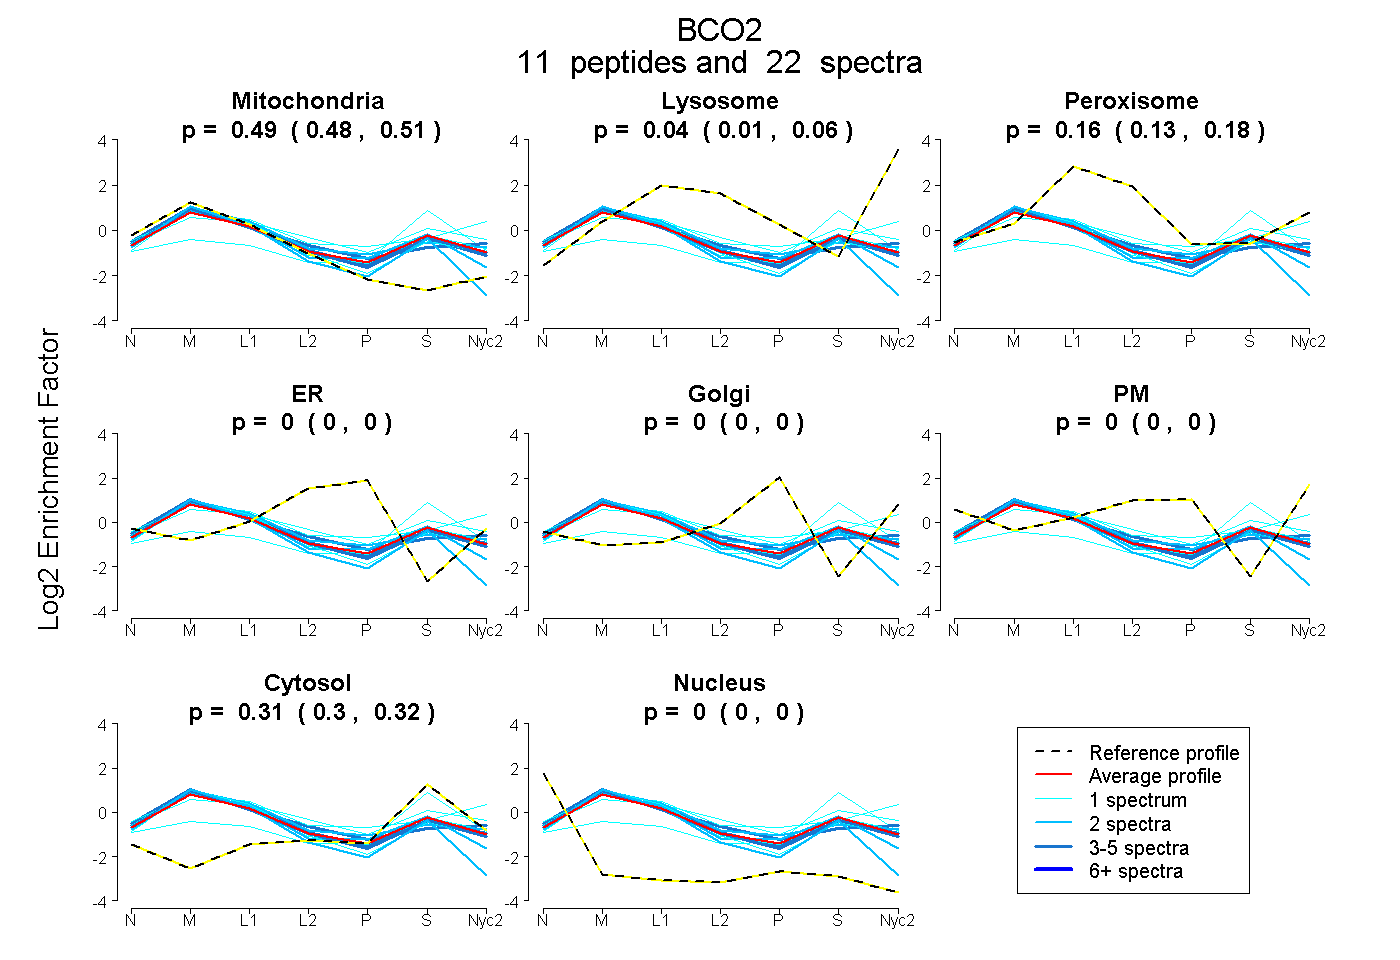
0.483 | 0.505
0.012 | 0.059
0.131 | 0.176
0.000 | 0.000
0.000 | 0.000
0.000 | 0.000
0.303 | 0.319
0.000 | 0.000
9peptides
spectra
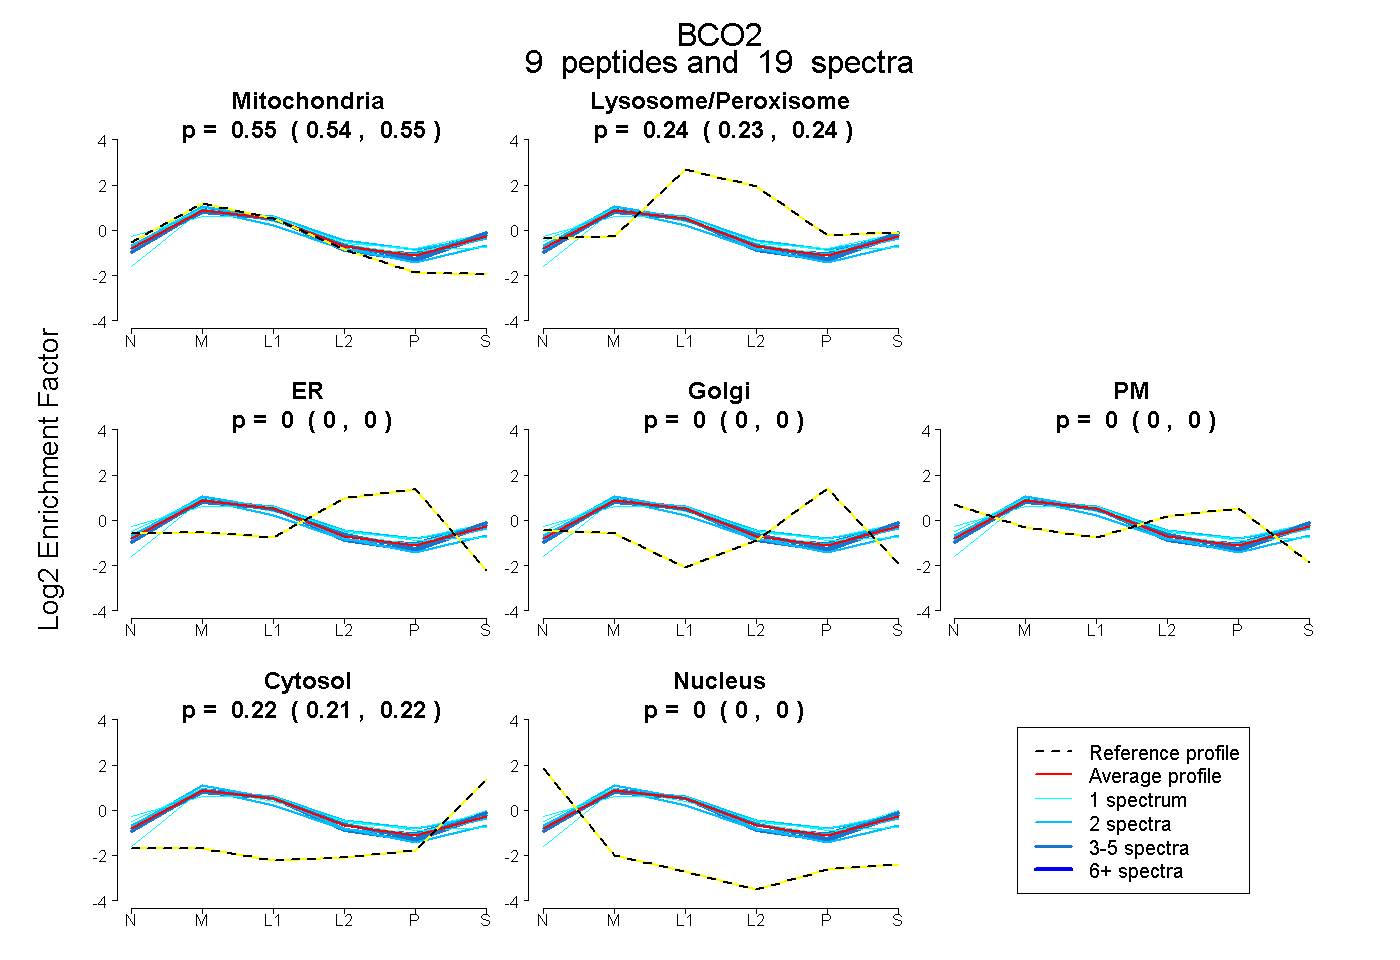
0.539 | 0.553
0.229 | 0.240
0.000 | 0.000
0.000 | 0.000
0.000 | 0.000
0.213 | 0.222
0.000 | 0.000
18peptides
spectra
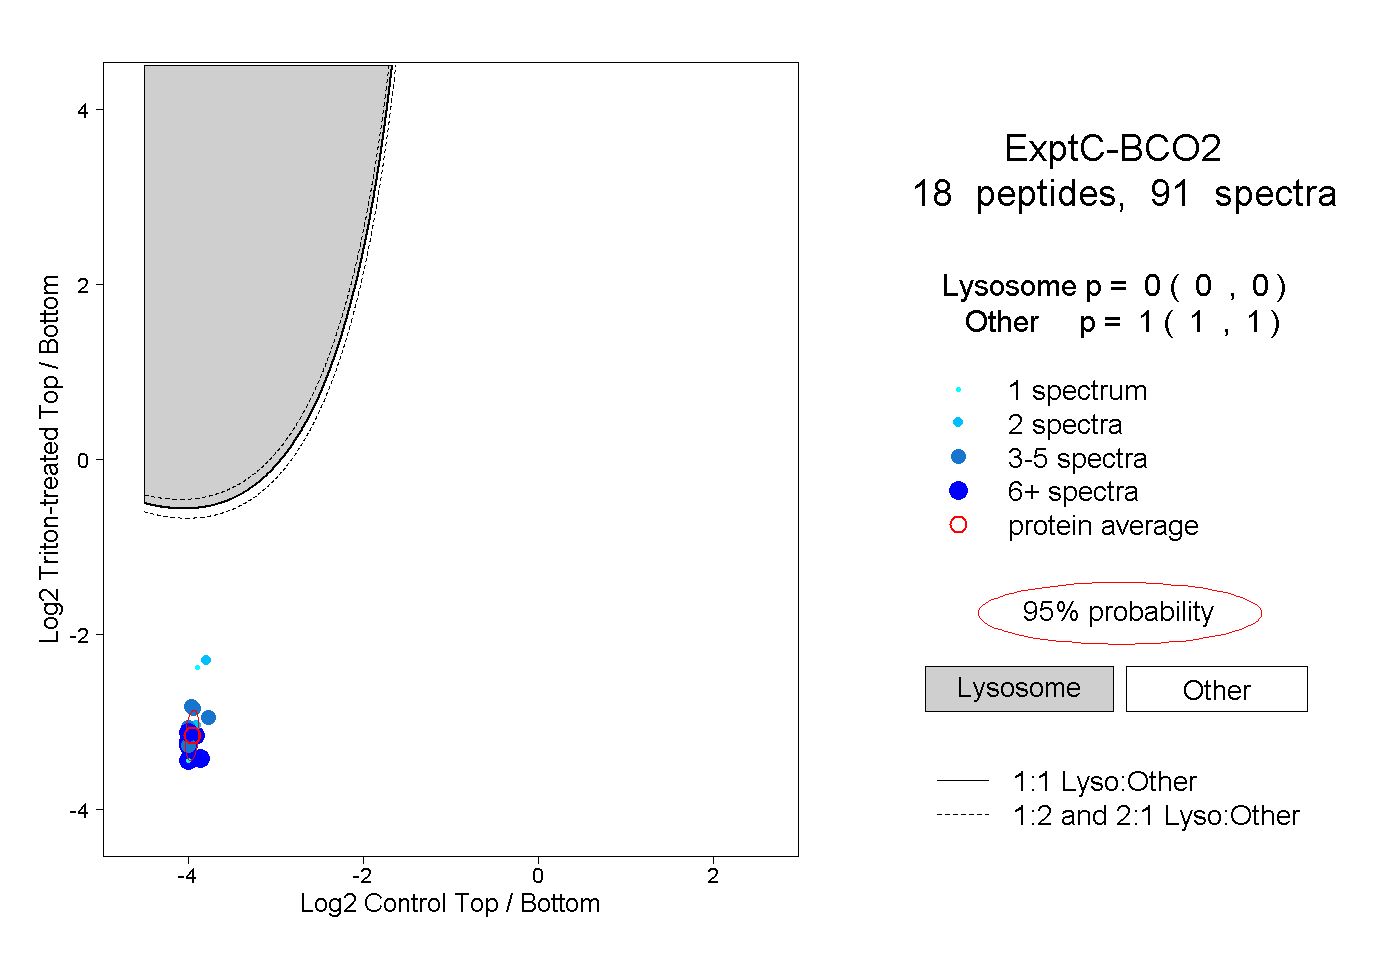
0.000 | 0.000
1.000 | 1.000
5peptides
spectra
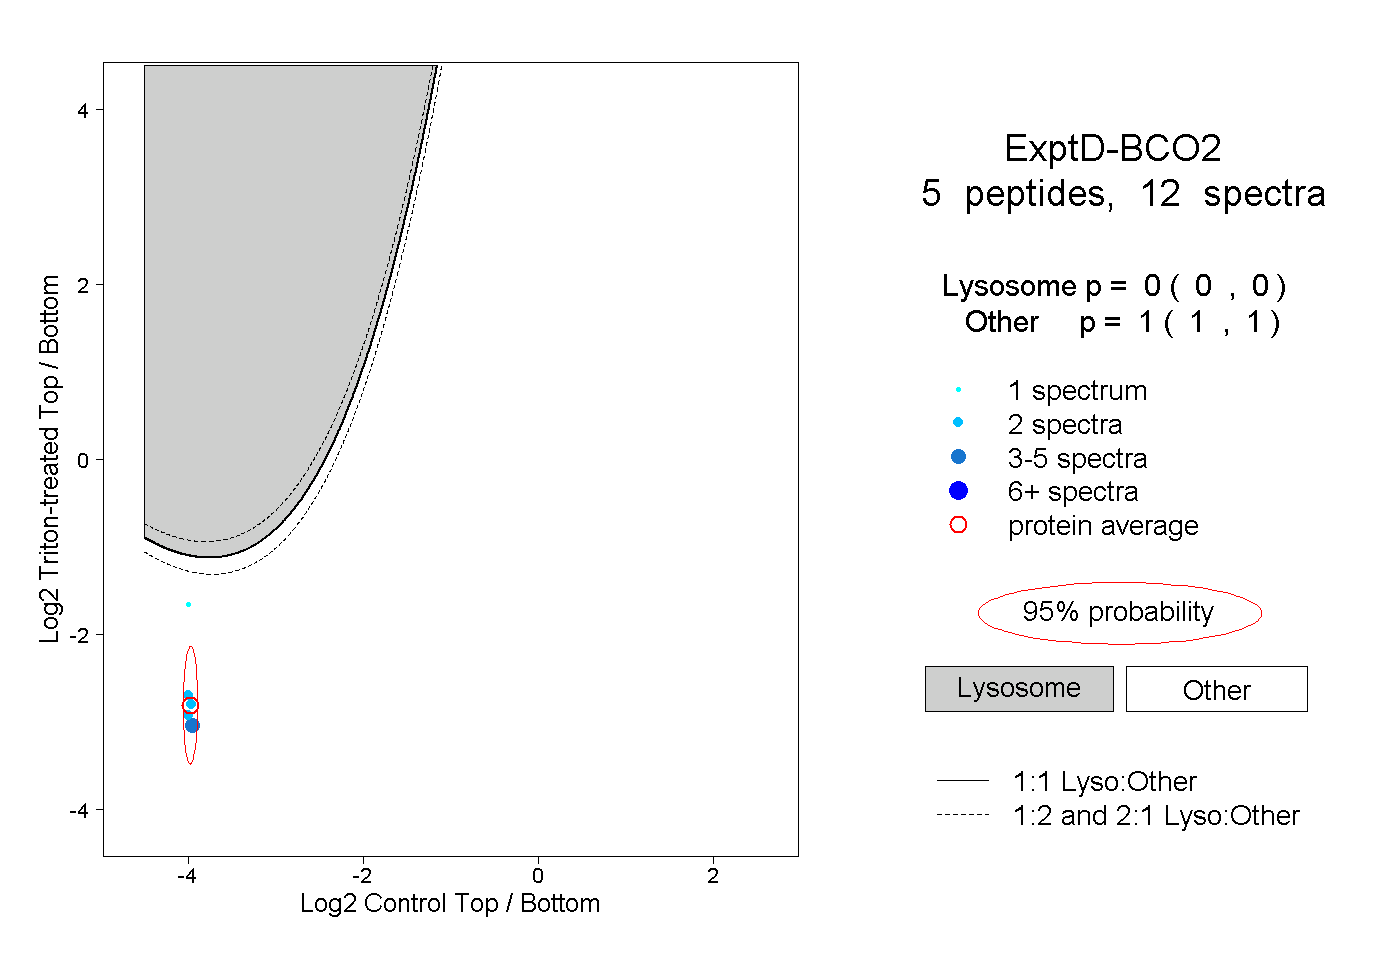
0.000 | 0.000
1.000 | 1.000