 13
13peptides
spectra
0.000 | 0.009
0.000 | 0.000
0.000 | 0.000
0.000 | 0.000
0.000 | 0.000
0.000 | 0.000
0.988 | 1.000
0.000 | 0.000
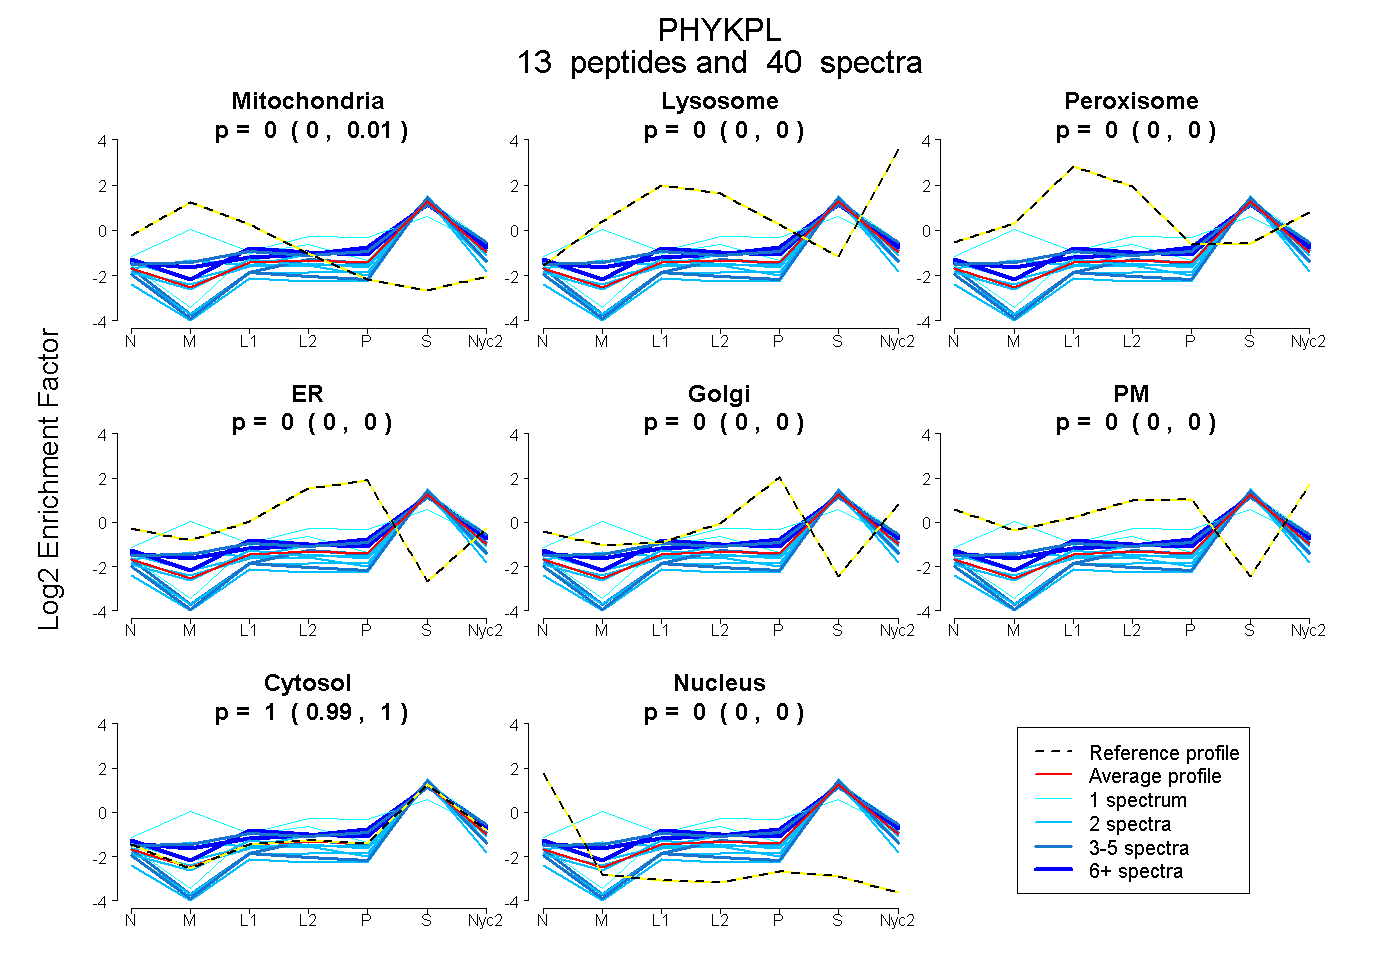
| Plot | Mito | Lyso | Perox | ER | Golgi | PM | Cytosol | Nucleus | |||||
| Expt A |
13 peptides |
40 spectra |
|
0.000 0.000 | 0.009 |
0.000 0.000 | 0.000 |
0.000 0.000 | 0.000 |
0.000 0.000 | 0.000 |
0.000 0.000 | 0.000 |
0.000 0.000 | 0.000 |
1.000 0.988 | 1.000 |
0.000 0.000 | 0.000 |
| 2 spectra, LSETLPEK | 0.000 | 0.014 | 0.000 | 0.000 | 0.052 | 0.000 | 0.934 | 0.000 | ||
| 2 spectra, GQGQYLYDEQGR | 0.000 | 0.000 | 0.000 | 0.000 | 0.000 | 0.000 | 0.960 | 0.040 | ||
| 2 spectra, SIGNGHPVACLATTQAVSR | 0.000 | 0.000 | 0.000 | 0.000 | 0.000 | 0.000 | 0.971 | 0.029 | ||
| 1 spectrum, NLDGQK | 0.188 | 0.086 | 0.053 | 0.129 | 0.000 | 0.000 | 0.544 | 0.000 | ||
| 3 spectra, LDDILTDMEEK | 0.000 | 0.000 | 0.000 | 0.000 | 0.000 | 0.000 | 1.000 | 0.000 | ||
| 2 spectra, AGGLFVADEIQVGFGR | 0.000 | 0.000 | 0.000 | 0.000 | 0.000 | 0.000 | 0.993 | 0.007 | ||
| 5 spectra, YLHDNIVDYAQR | 0.067 | 0.108 | 0.008 | 0.000 | 0.000 | 0.000 | 0.817 | 0.000 | ||
| 6 spectra, LLSSSCR | 0.022 | 0.049 | 0.026 | 0.000 | 0.061 | 0.000 | 0.842 | 0.000 | ||
| 8 spectra, SCETLR | 0.000 | 0.000 | 0.119 | 0.000 | 0.000 | 0.000 | 0.881 | 0.000 | ||
| 2 spectra, HPIIGDVR | 0.141 | 0.000 | 0.000 | 0.000 | 0.000 | 0.000 | 0.859 | 0.000 | ||
| 1 spectrum, HVISSAQK | 0.000 | 0.030 | 0.005 | 0.000 | 0.000 | 0.000 | 0.965 | 0.000 | ||
| 4 spectra, TPATEEAEYLVSR | 0.000 | 0.000 | 0.000 | 0.000 | 0.000 | 0.000 | 0.943 | 0.057 | ||
| 2 spectra, LFFPENPVK | 0.000 | 0.000 | 0.000 | 0.000 | 0.000 | 0.000 | 0.977 | 0.023 |
| Plot | Mito | Lyso or Perox | ER | Golgi | PM | Cytosol | Nucleus | ||||||
| Expt B |
4 peptides |
9 spectra |
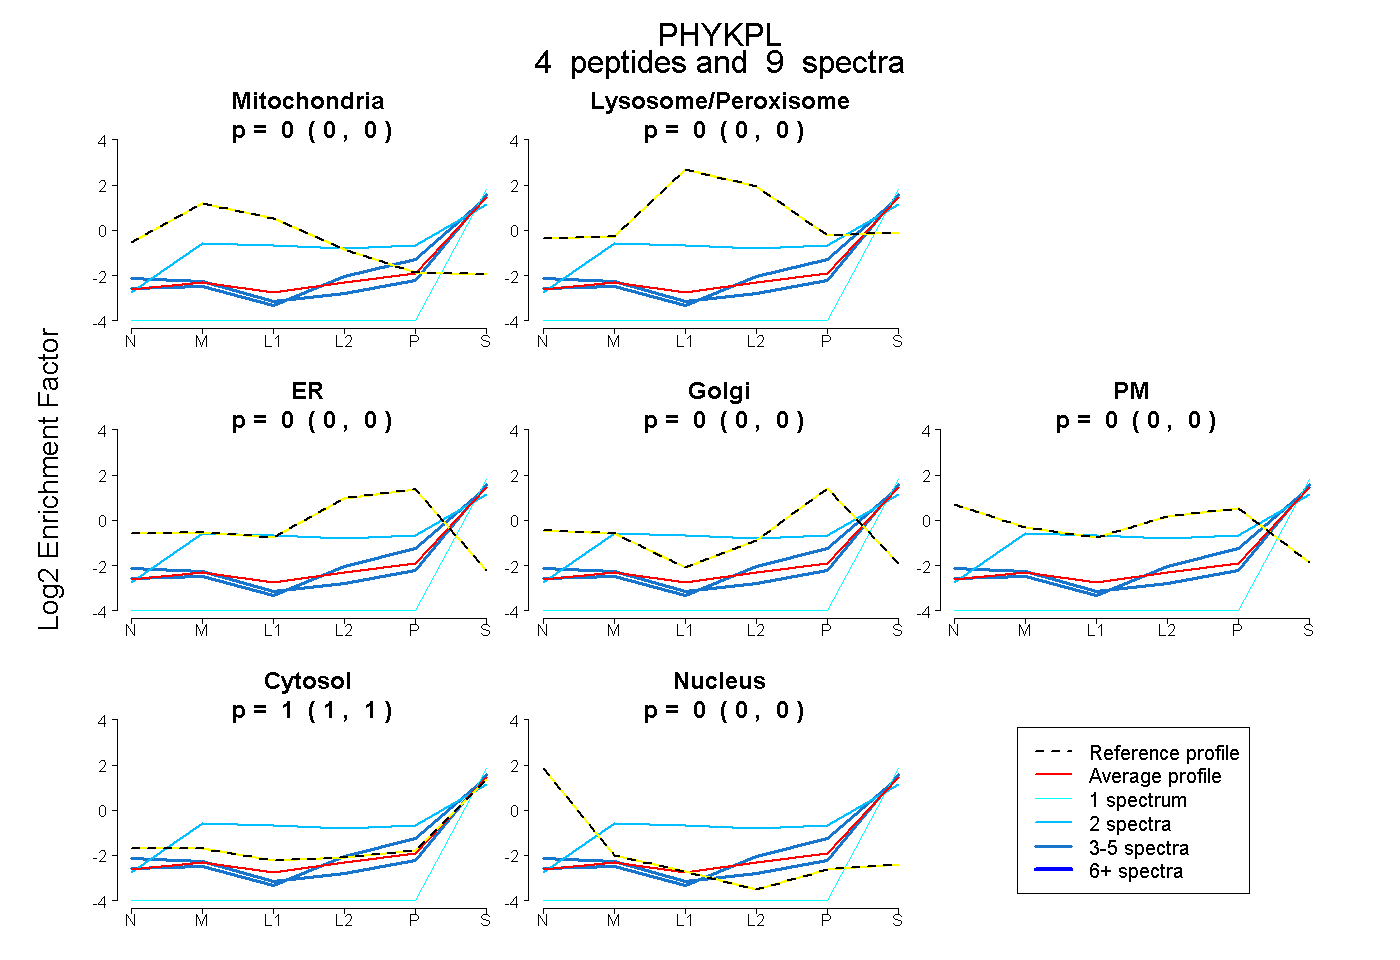 |
0.000 0.000 | 0.000 |
0.000 0.000 | 0.000 |
0.000 0.000 | 0.000 |
0.000 0.000 | 0.000 |
0.000 0.000 | 0.000 |
1.000 1.000 | 1.000 |
0.000 0.000 | 0.000 |
|||
| Plot | Lyso | Other | |||||||||||
| Expt C |
9 peptides |
18 spectra |
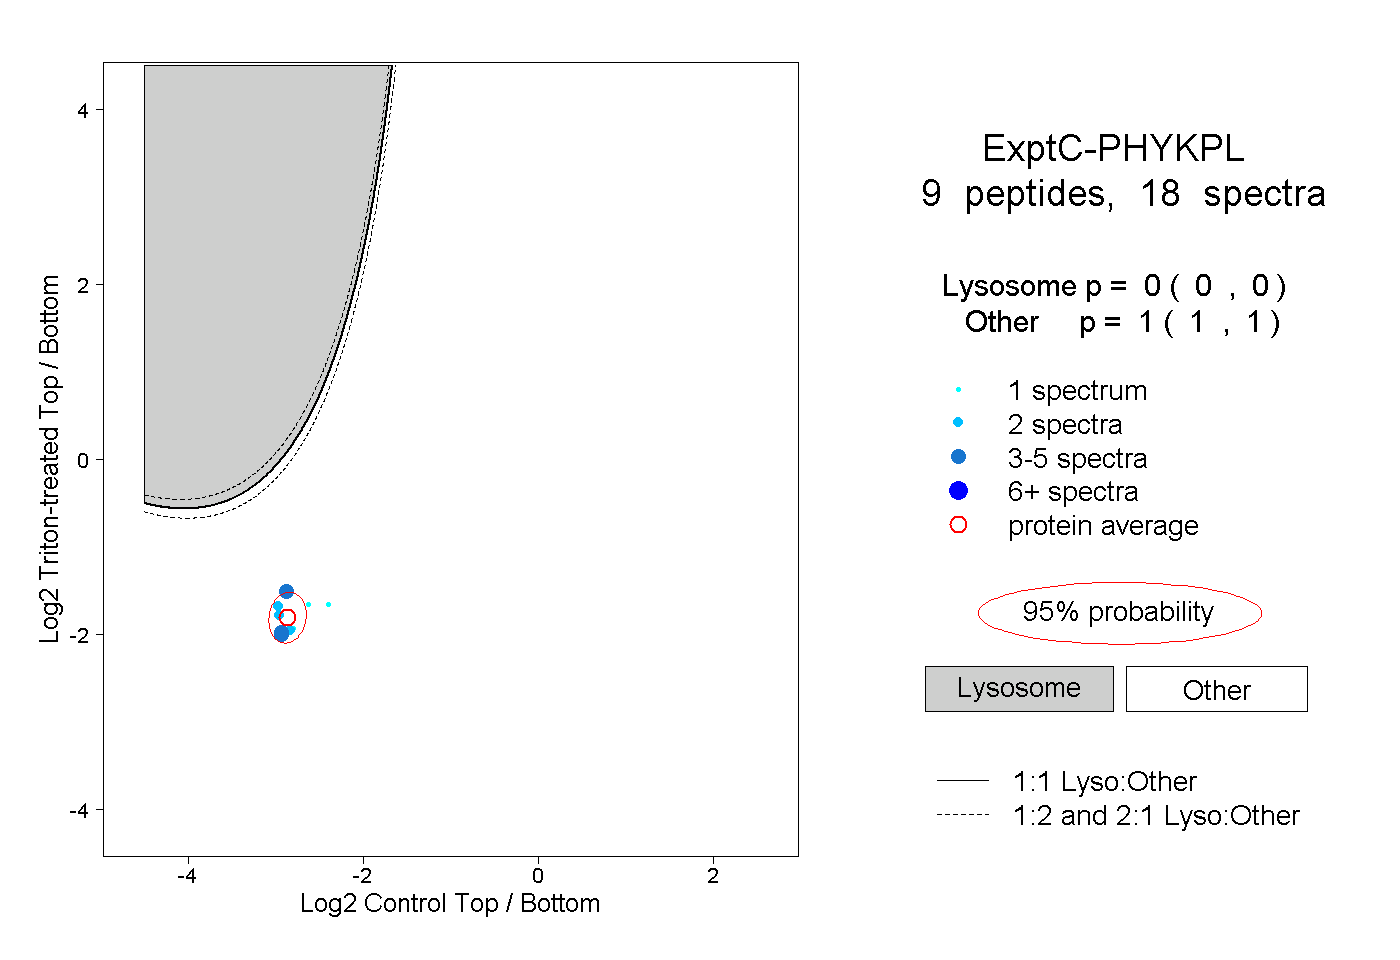 |
0.000 0.000 | 0.000 |
1.000 1.000 | 1.000 |
||||||||
| Plot | Lyso | Other | |||||||||||
| Expt D |
2 peptides |
5 spectra |
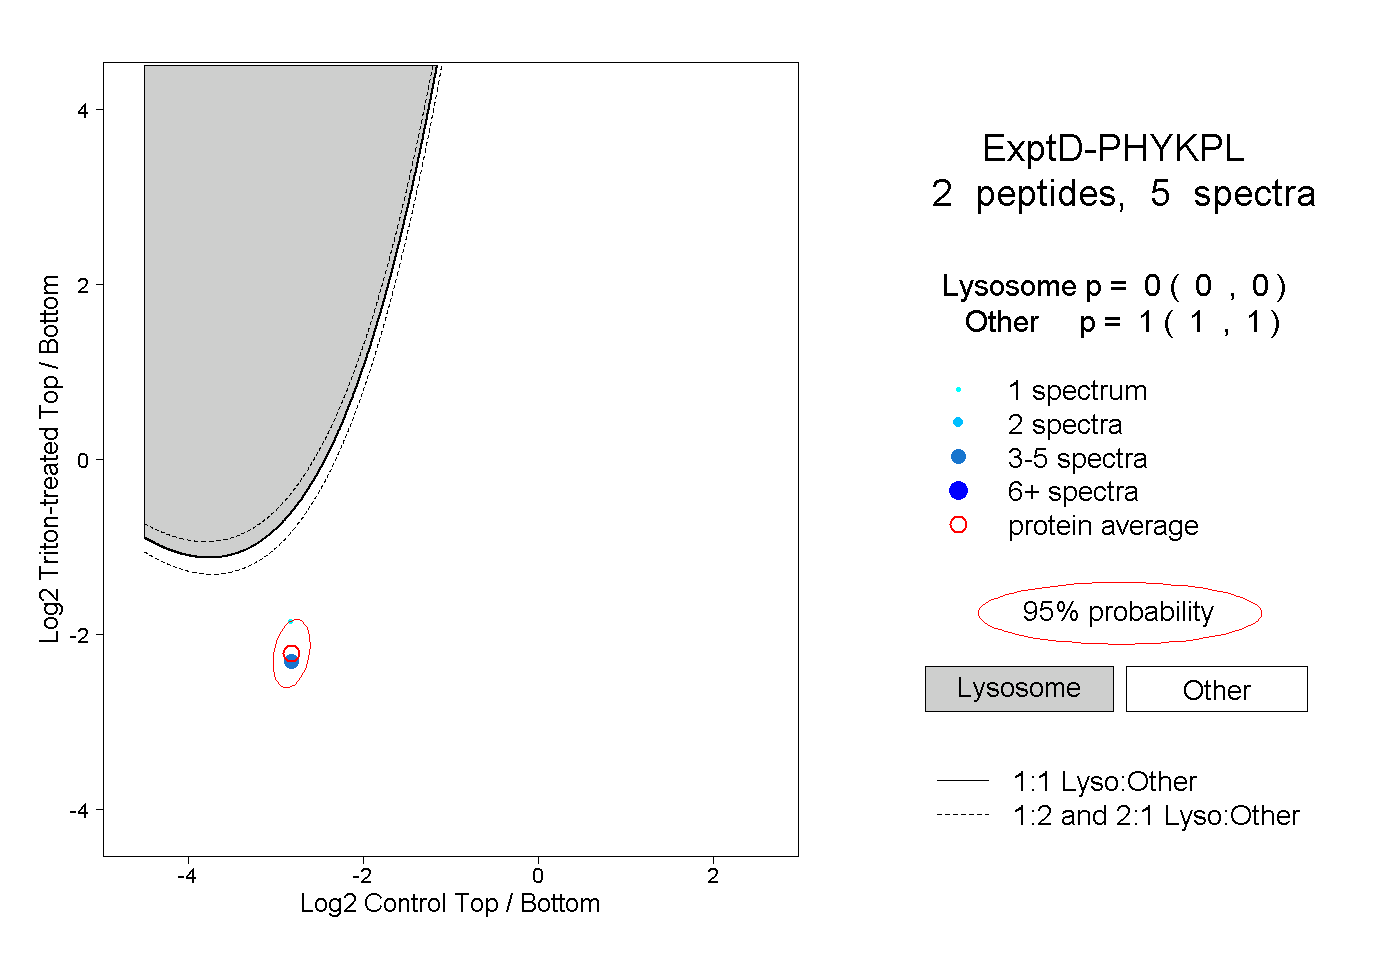 |
0.000 0.000 | 0.000 |
1.000 1.000 | 1.000 |