 2
2peptides
spectra
0.122 | 0.232
0.000 | 0.000
0.038 | 0.147
0.000 | 0.202
0.000 | 0.097
0.137 | 0.425
0.281 | 0.364
0.000 | 0.000
1peptide
spectrum
NA | NA
NA | NA
| Plot | Mito | Lyso | Perox | ER | Golgi | PM | Cytosol | Nucleus | |||||
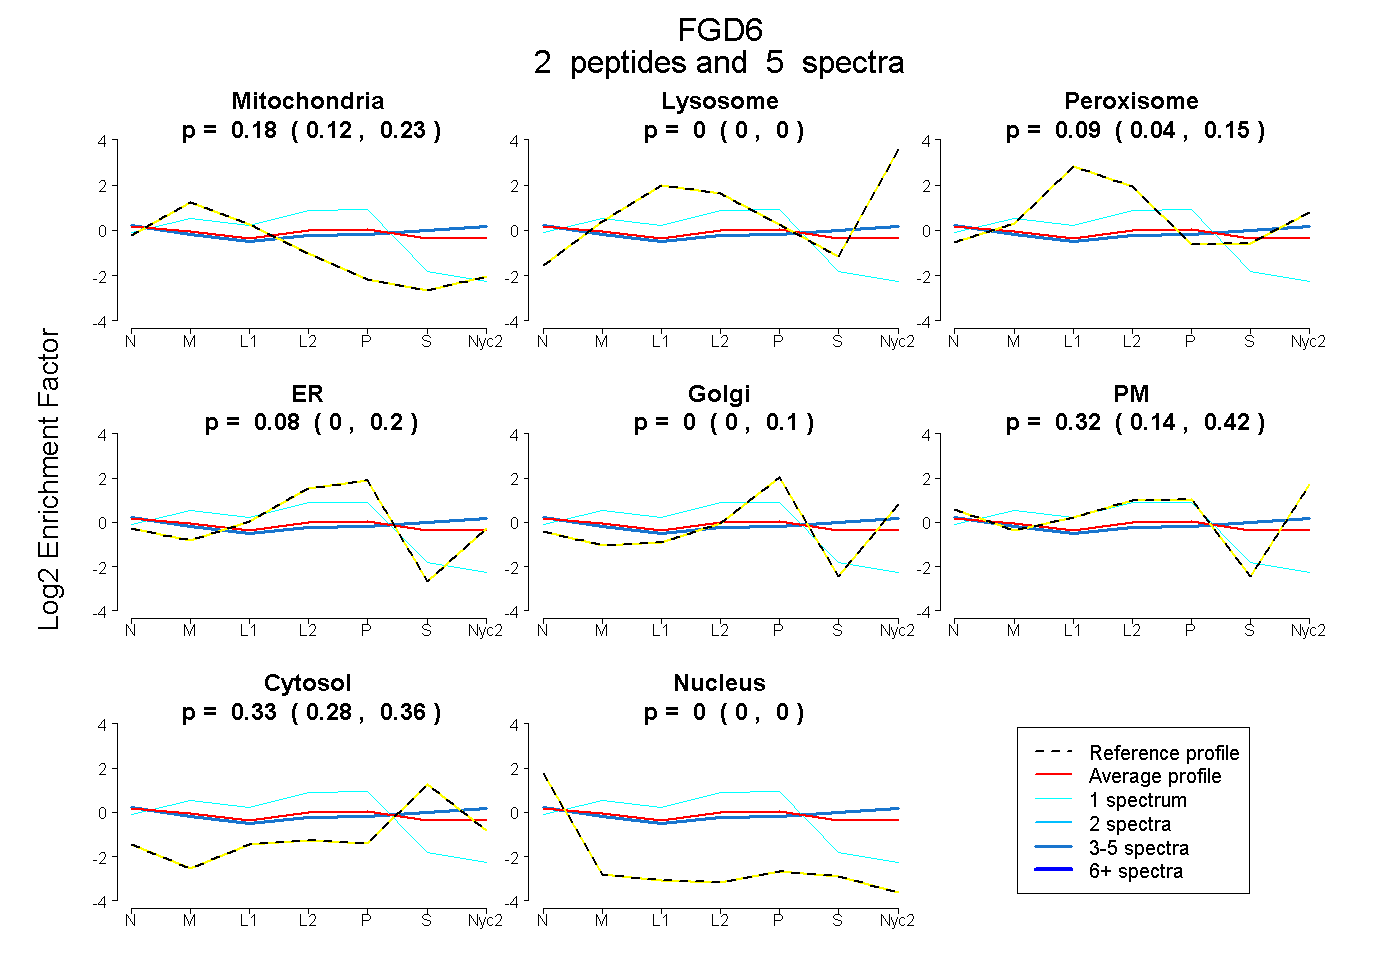
| Expt A |
2 peptides |
5 spectra |
|
0.184 0.122 | 0.232 |
0.000 0.000 | 0.000 |
0.092 0.038 | 0.147 |
0.075 0.000 | 0.202 |
0.000 0.000 | 0.097 |
0.319 0.137 | 0.425 |
0.330 0.281 | 0.364 |
0.000 0.000 | 0.000 |
||
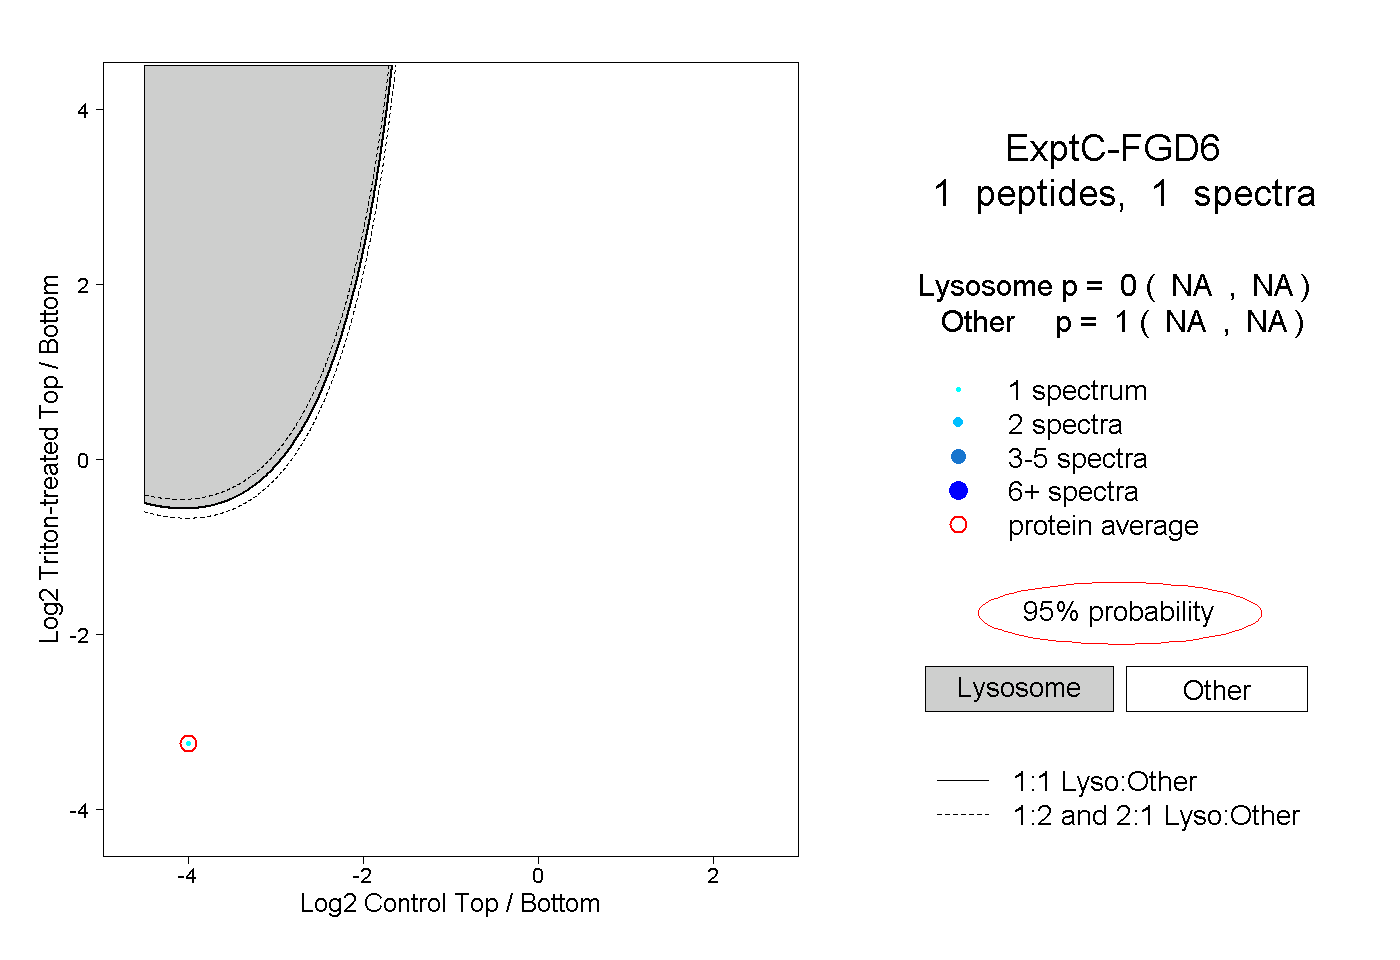
| Plot | Lyso | Other | |||||||||||
| Expt C |
1 peptide |
1 spectrum |
|
0.000 NA | NA |
1.000 NA | NA |