 9
9peptides
spectra
0.000 | 0.026
0.057 | 0.105
0.105 | 0.148
0.000 | 0.000
0.000 | 0.058
0.000 | 0.059
0.714 | 0.742
0.000 | 0.000
| Plot | Mito | Lyso | Perox | ER | Golgi | PM | Cytosol | Nucleus | |||||
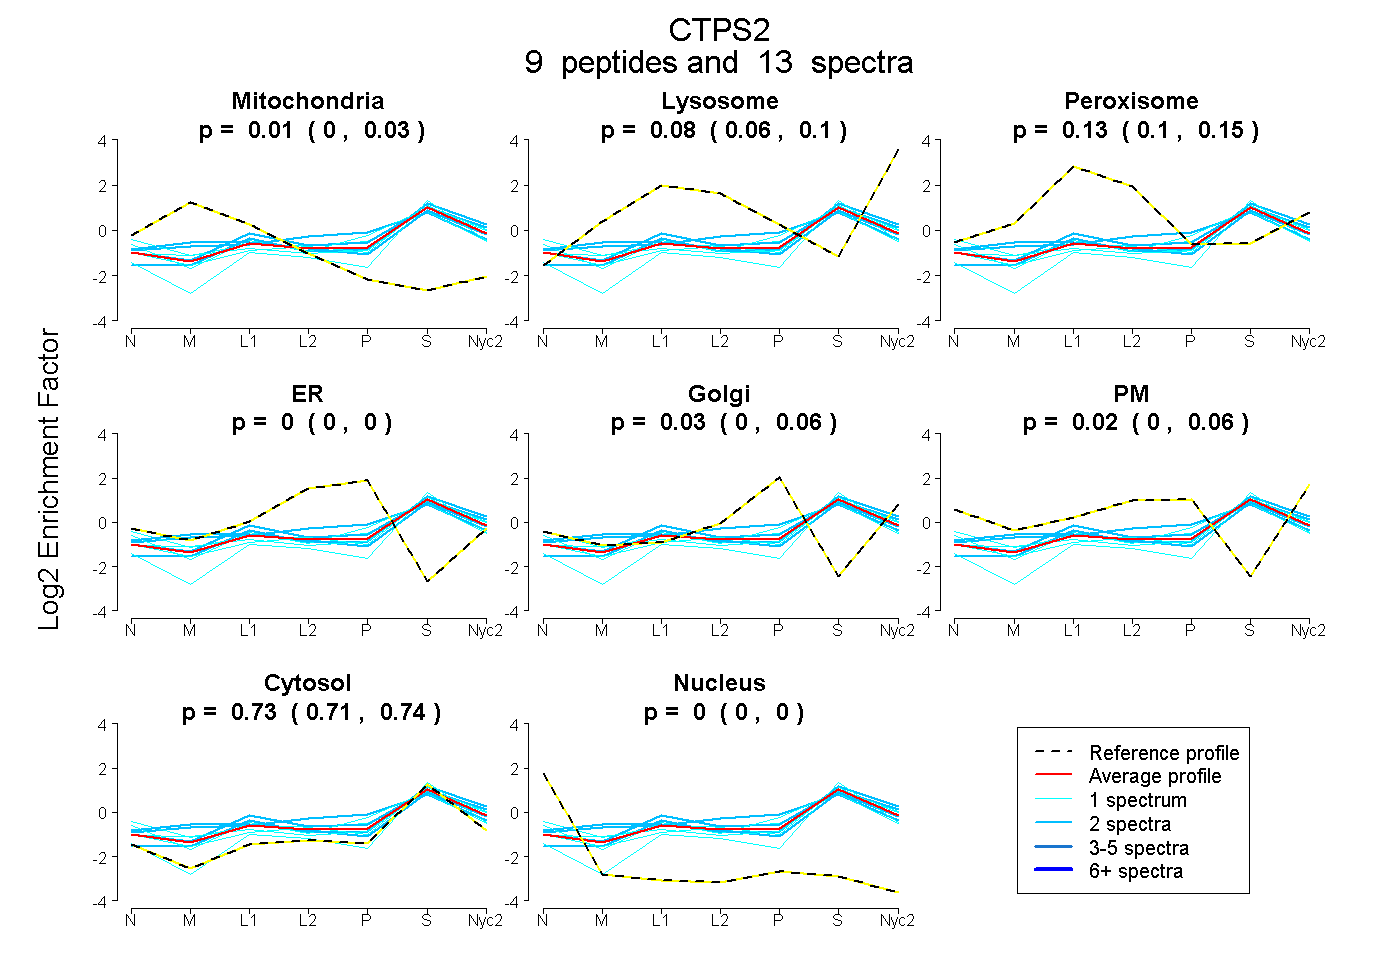
| Expt A |
9 peptides |
13 spectra |
|
0.007 0.000 | 0.026 |
0.080 0.057 | 0.105 |
0.131 0.105 | 0.148 |
0.000 0.000 | 0.000 |
0.032 0.000 | 0.058 |
0.021 0.000 | 0.059 |
0.729 0.714 | 0.742 |
0.000 0.000 | 0.000 |
| 1 spectrum, LYGDVPYIEER | 0.071 | 0.192 | 0.000 | 0.000 | 0.000 | 0.000 | 0.737 | 0.000 | ||
| 2 spectra, GIIASSIGTILK | 0.000 | 0.128 | 0.167 | 0.000 | 0.036 | 0.000 | 0.668 | 0.000 | ||
| 1 spectrum, DLCFVGEDVDGK | 0.050 | 0.000 | 0.131 | 0.000 | 0.010 | 0.148 | 0.661 | 0.000 | ||
| 2 spectra, LQAISWAR | 0.154 | 0.134 | 0.085 | 0.000 | 0.000 | 0.000 | 0.626 | 0.000 | ||
| 1 spectrum, LDLPINDCSNNLLFK | 0.000 | 0.032 | 0.100 | 0.000 | 0.076 | 0.104 | 0.689 | 0.000 | ||
| 1 spectrum, YILVTGGVISGIGK | 0.000 | 0.023 | 0.018 | 0.000 | 0.000 | 0.000 | 0.959 | 0.000 | ||
| 2 spectra, ALEHSALAINHK | 0.000 | 0.230 | 0.010 | 0.000 | 0.000 | 0.000 | 0.760 | 0.000 | ||
| 2 spectra, AEDPVK | 0.015 | 0.000 | 0.238 | 0.000 | 0.181 | 0.000 | 0.566 | 0.000 | ||
| 1 spectrum, TKPTQNSVR | 0.000 | 0.078 | 0.087 | 0.000 | 0.000 | 0.048 | 0.786 | 0.000 |
| Plot | Mito | Lyso or Perox | ER | Golgi | PM | Cytosol | Nucleus | ||||||
| Expt B |
1 peptide |
1 spectrum |
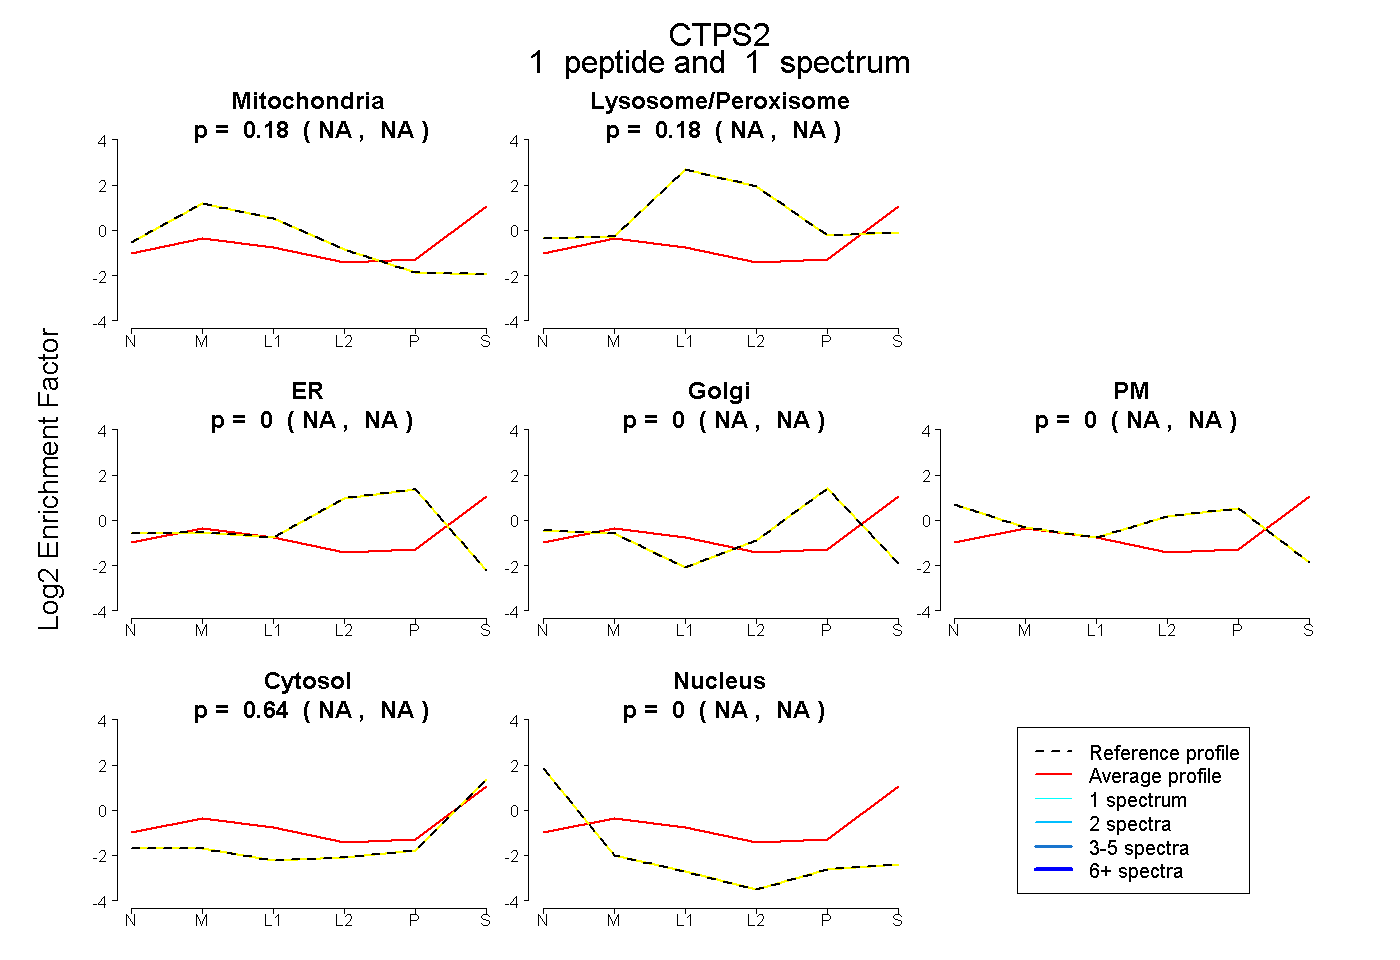 |
0.180 NA | NA |
0.180 NA | NA |
0.000 NA | NA |
0.000 NA | NA |
0.000 NA | NA |
0.641 NA | NA |
0.000 NA | NA |
|||
| Plot | Lyso | Other | |||||||||||
| Expt C |
11 peptides |
21 spectra |
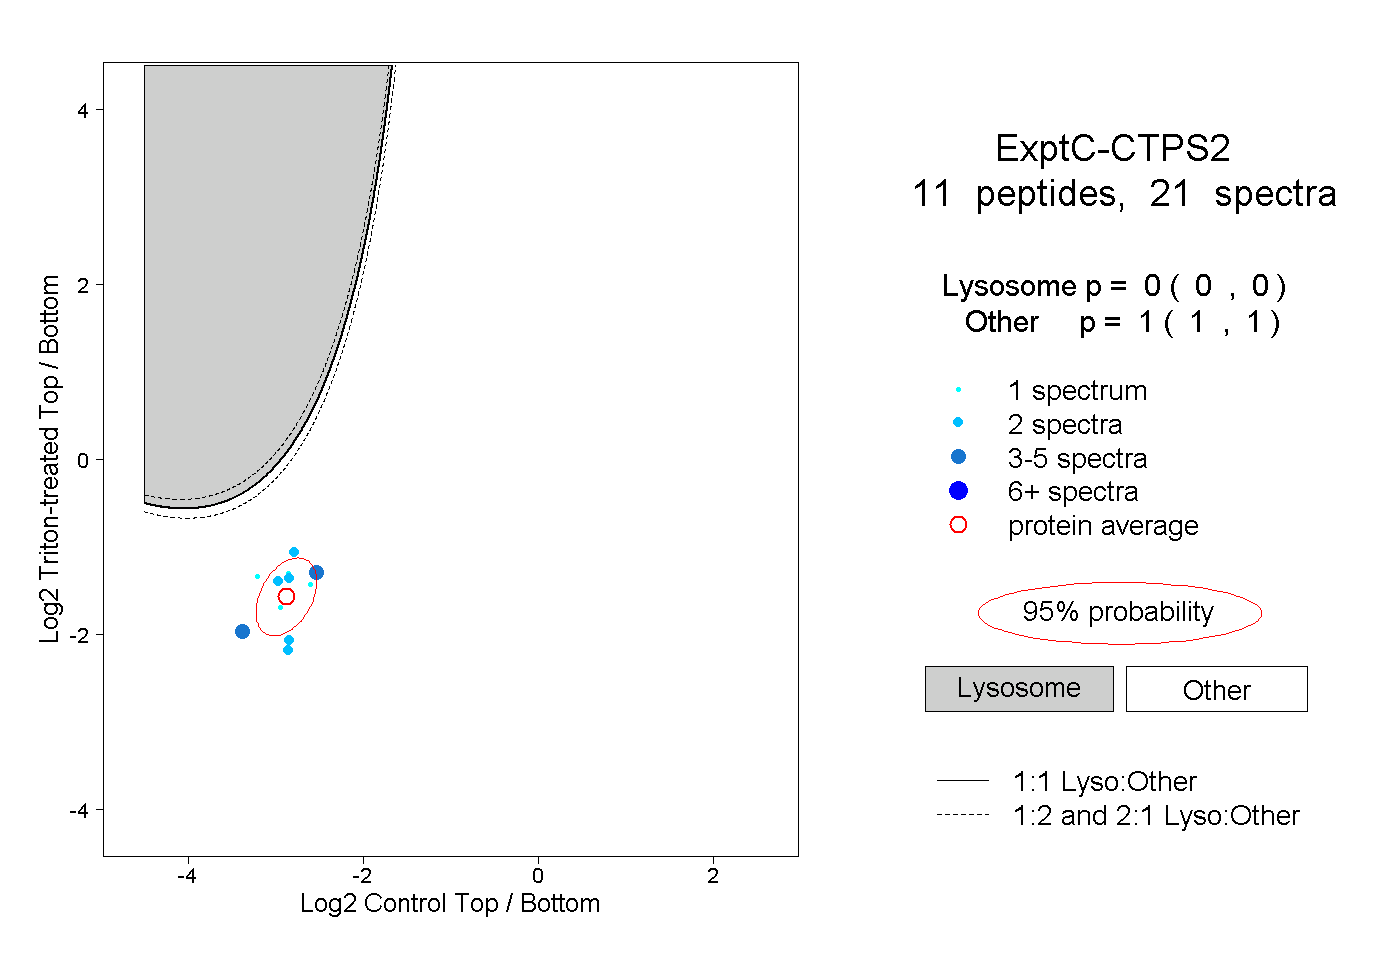 |
0.000 0.000 | 0.000 |
1.000 1.000 | 1.000 |
||||||||
| Plot | Lyso | Other | |||||||||||
| Expt D |
2 peptides |
2 spectra |
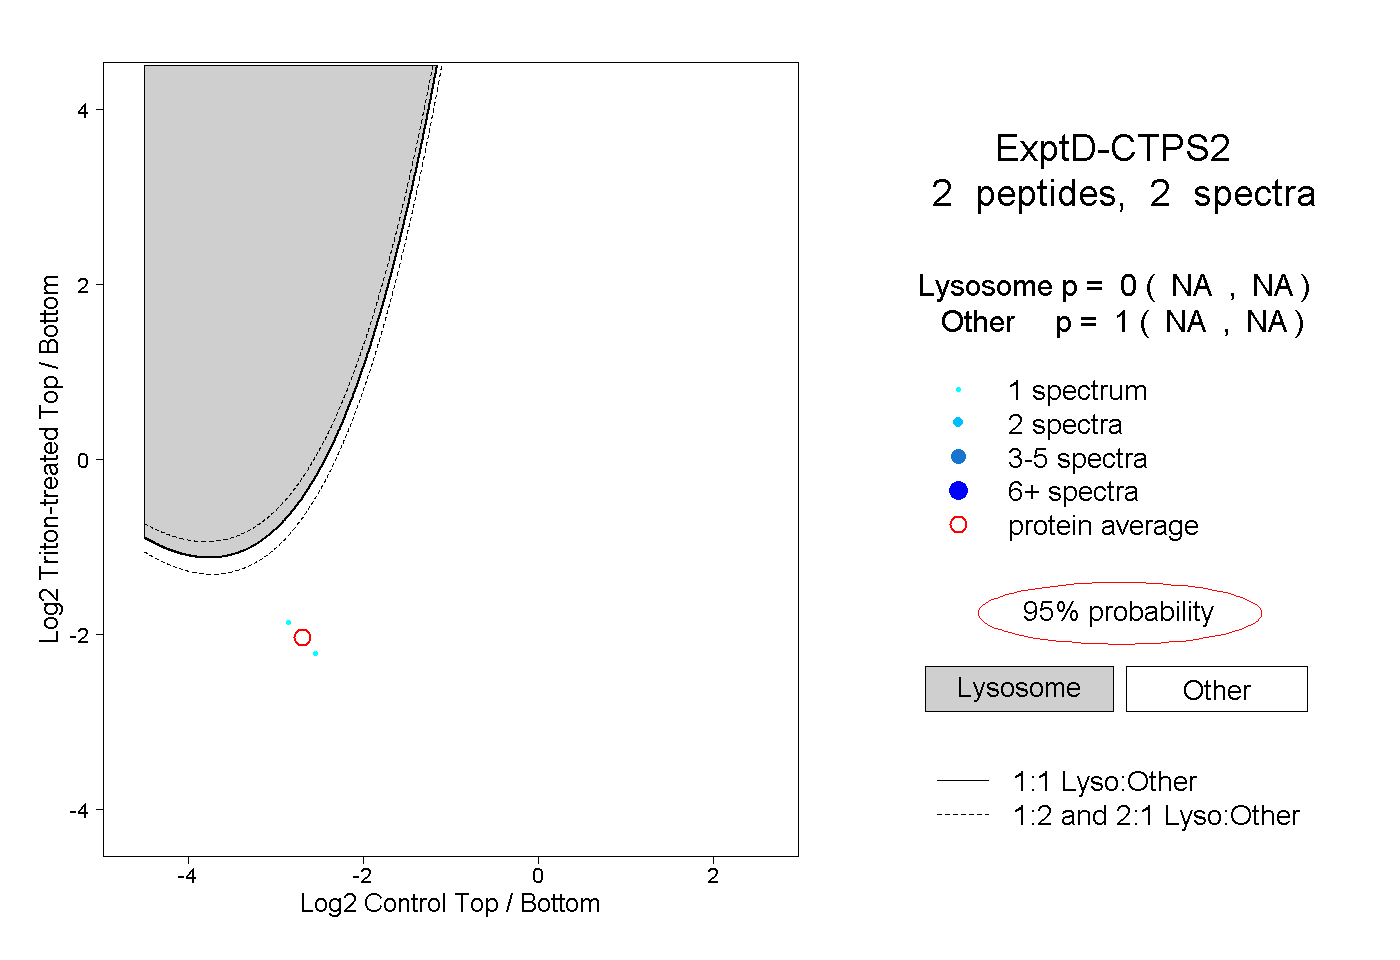 |
0.000 NA | NA |
1.000 NA | NA |