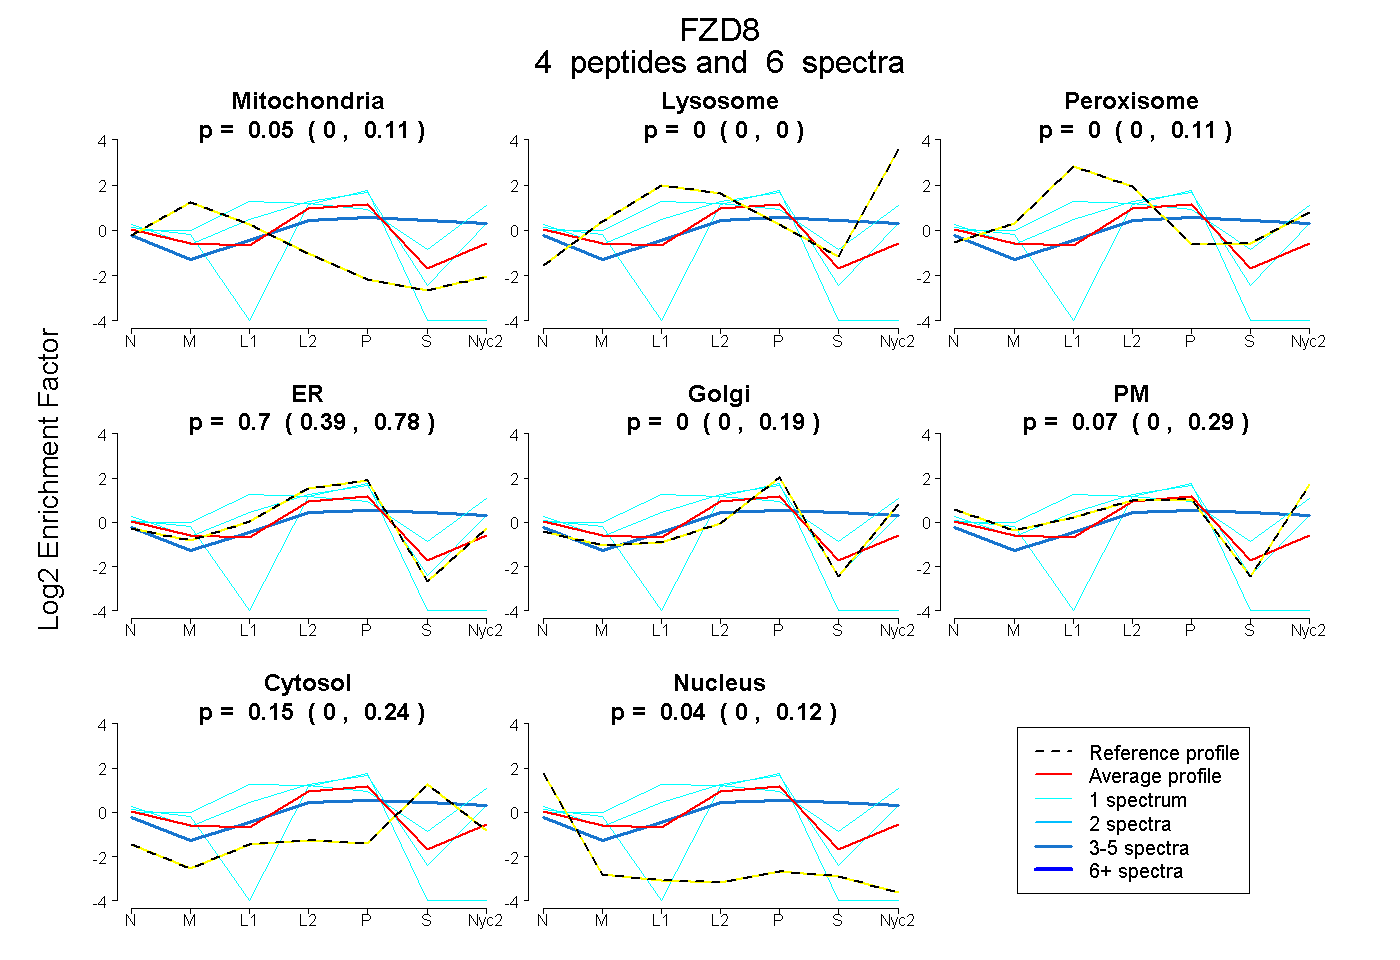
 4
4peptides
spectra
0.000 | 0.115
0.000 | 0.000
0.000 | 0.107
0.386 | 0.777
0.000 | 0.187
0.000 | 0.289
0.000 | 0.241
0.000 | 0.116
| Plot | Mito | Lyso | Perox | ER | Golgi | PM | Cytosol | Nucleus | |||||
| Expt A |
4 peptides |
6 spectra |
|
0.046 0.000 | 0.115 |
0.000 0.000 | 0.000 |
0.000 0.000 | 0.107 |
0.702 0.386 | 0.777 |
0.000 0.000 | 0.187 |
0.066 0.000 | 0.289 |
0.148 0.000 | 0.241 |
0.038 0.000 | 0.116 |
| 3 spectra, GEYEELGAVEQHVR | 0.000 | 0.029 | 0.097 | 0.143 | 0.000 | 0.260 | 0.471 | 0.000 | ||
| 1 spectrum, LVAGHEK | 0.000 | 0.023 | 0.514 | 0.000 | 0.284 | 0.179 | 0.000 | 0.000 | ||
| 1 spectrum, ARPPGGGAAPCEPGCQCR | 0.000 | 0.000 | 0.000 | 0.617 | 0.000 | 0.000 | 0.000 | 0.383 | ||
| 1 spectrum, AGCAPLMR | 0.000 | 0.000 | 0.056 | 0.622 | 0.000 | 0.320 | 0.000 | 0.002 |
| Plot | Lyso | Other | |||||||||||
| Expt C |
4 peptides |
7 spectra |
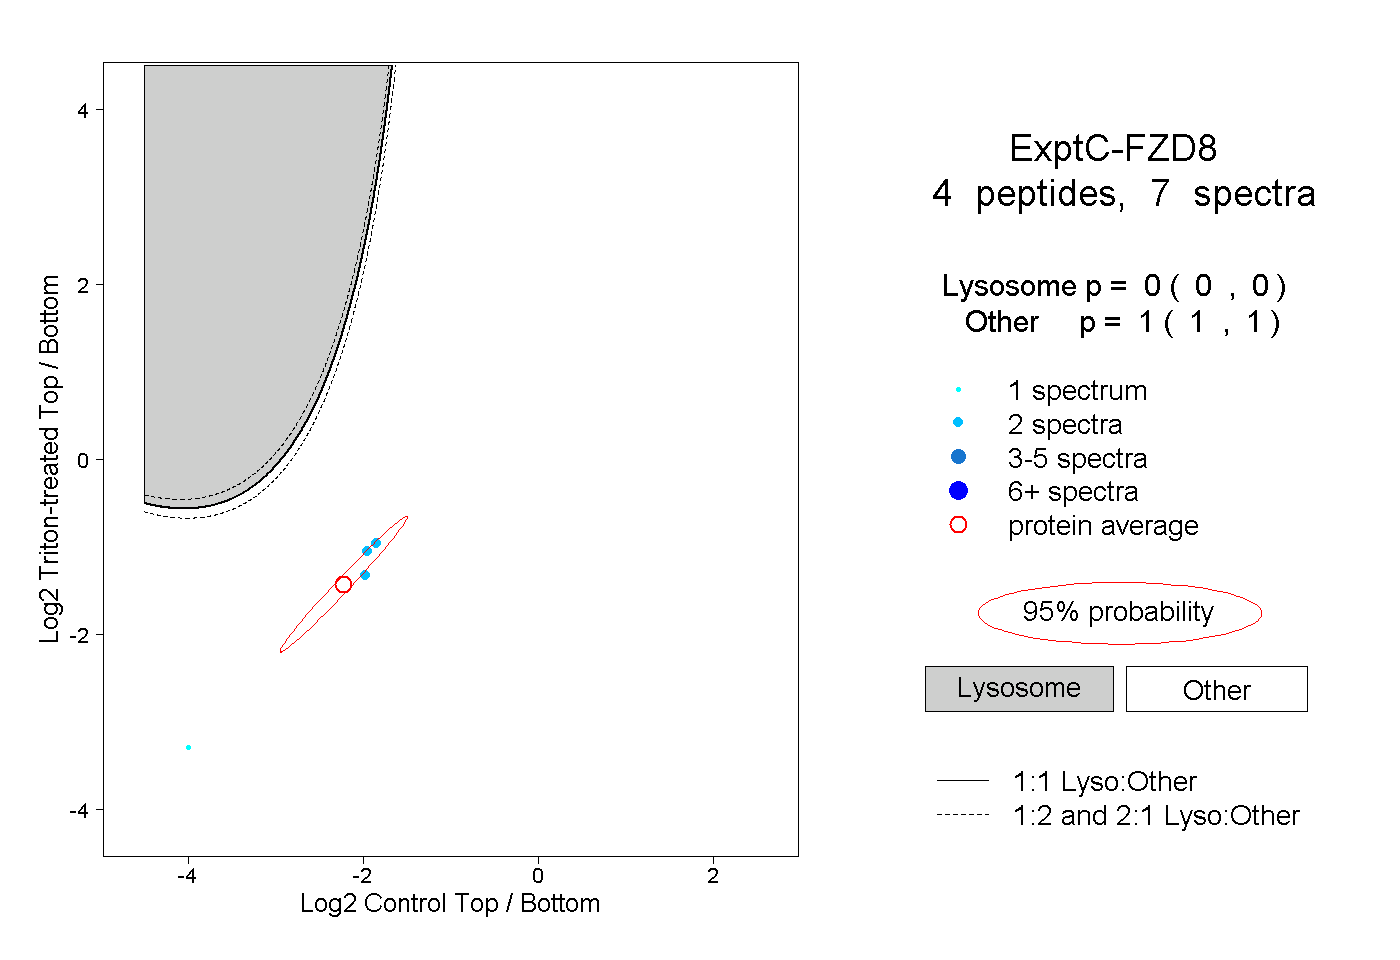 |
0.000 0.000 | 0.000 |
1.000 1.000 | 1.000 |