 5
5peptides
spectra
0.018 | 0.040
0.000 | 0.000
0.000 | 0.000
0.857 | 0.905
0.000 | 0.017
0.066 | 0.099
0.000 | 0.000
0.000 | 0.000
| Plot | Mito | Lyso | Perox | ER | Golgi | PM | Cytosol | Nucleus | |||||
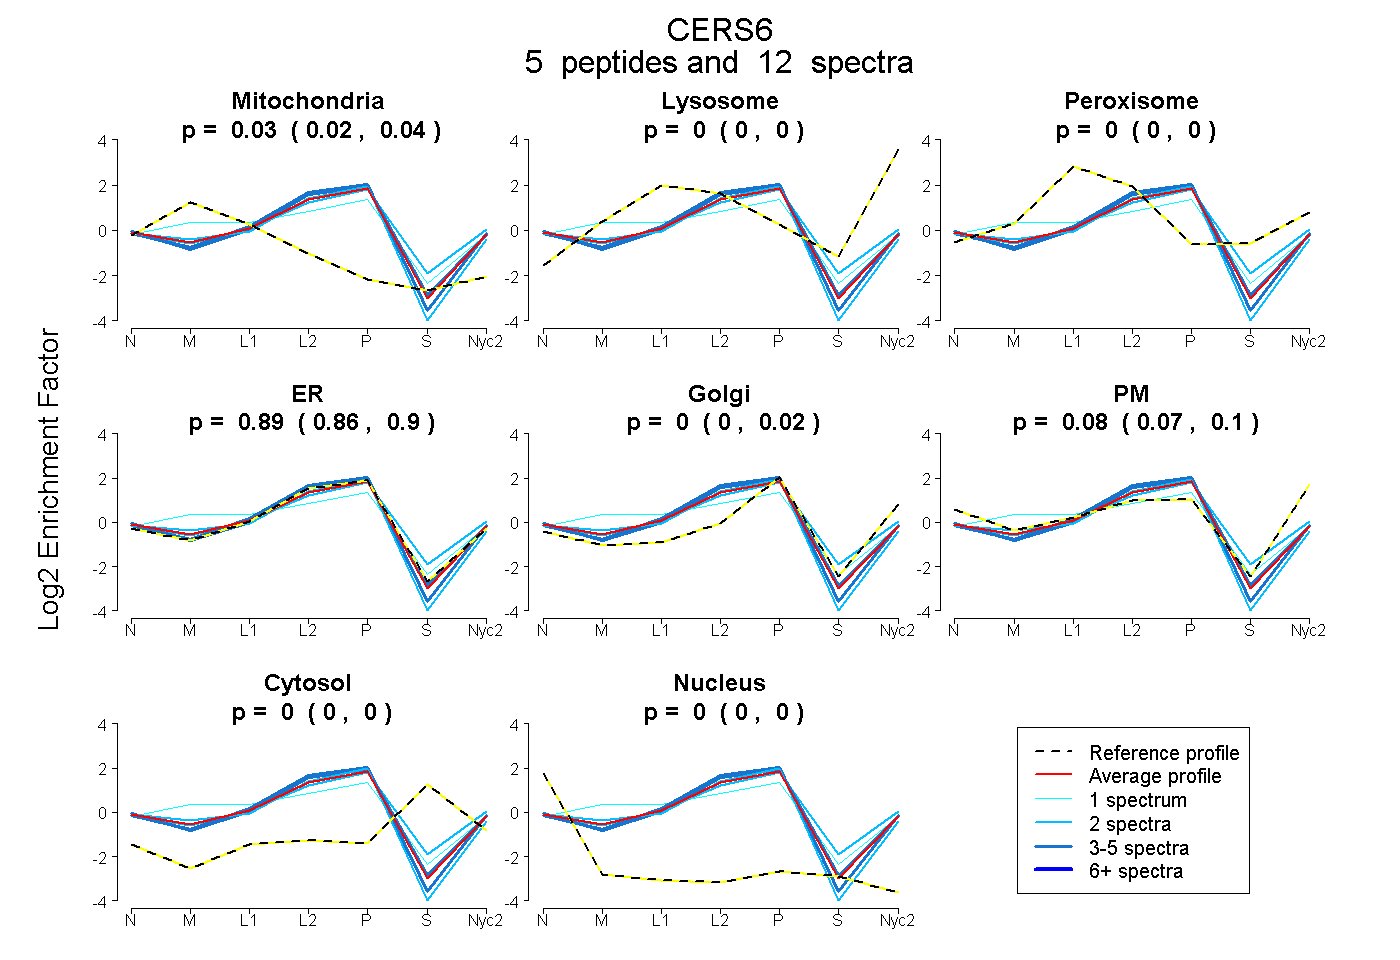
| Expt A |
5 peptides |
12 spectra |
|
0.030 0.018 | 0.040 |
0.000 0.000 | 0.000 |
0.000 0.000 | 0.000 |
0.886 0.857 | 0.905 |
0.000 0.000 | 0.017 |
0.084 0.066 | 0.099 |
0.000 0.000 | 0.000 |
0.000 0.000 | 0.000 |
| 2 spectra, FCESMWR | 0.000 | 0.000 | 0.119 | 0.640 | 0.219 | 0.000 | 0.022 | 0.000 | ||
| 2 spectra, QTPWLWNTR | 0.040 | 0.000 | 0.000 | 0.960 | 0.000 | 0.000 | 0.000 | 0.000 | ||
| 1 spectrum, MANYAK | 0.194 | 0.082 | 0.000 | 0.625 | 0.020 | 0.079 | 0.000 | 0.000 | ||
| 4 spectra, QLDWDVR | 0.000 | 0.000 | 0.000 | 0.980 | 0.000 | 0.020 | 0.000 | 0.000 | ||
| 3 spectra, NQEKPSTLTR | 0.000 | 0.000 | 0.000 | 0.950 | 0.000 | 0.047 | 0.000 | 0.004 |
| Plot | Lyso | Other | |||||||||||
| Expt C |
4 peptides |
16 spectra |
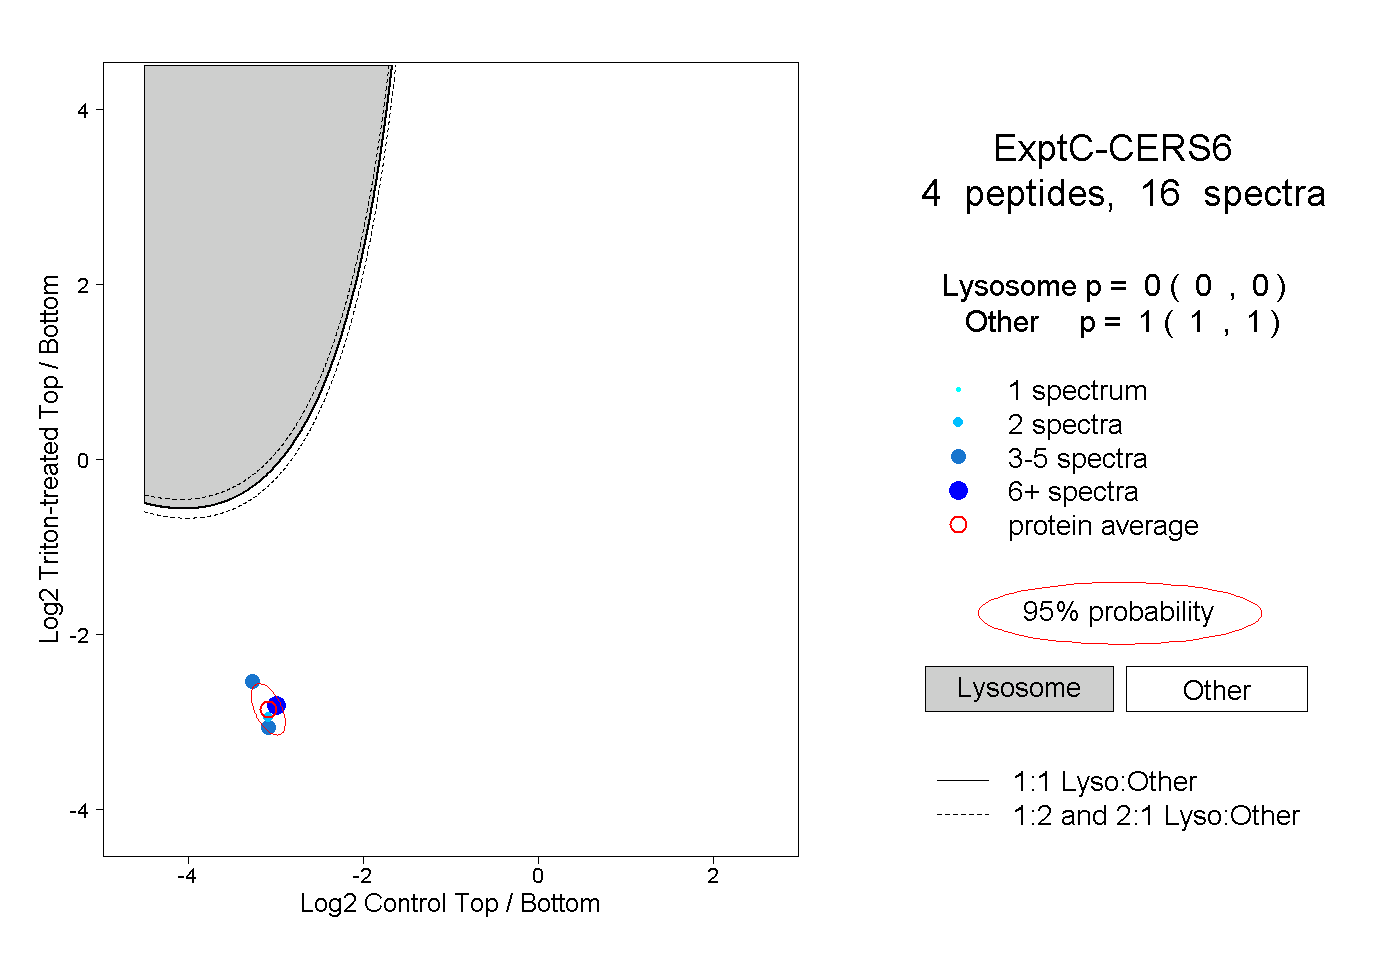 |
0.000 0.000 | 0.000 |
1.000 1.000 | 1.000 |
||||||||
| Plot | Lyso | Other | |||||||||||
| Expt D |
1 peptide |
1 spectrum |
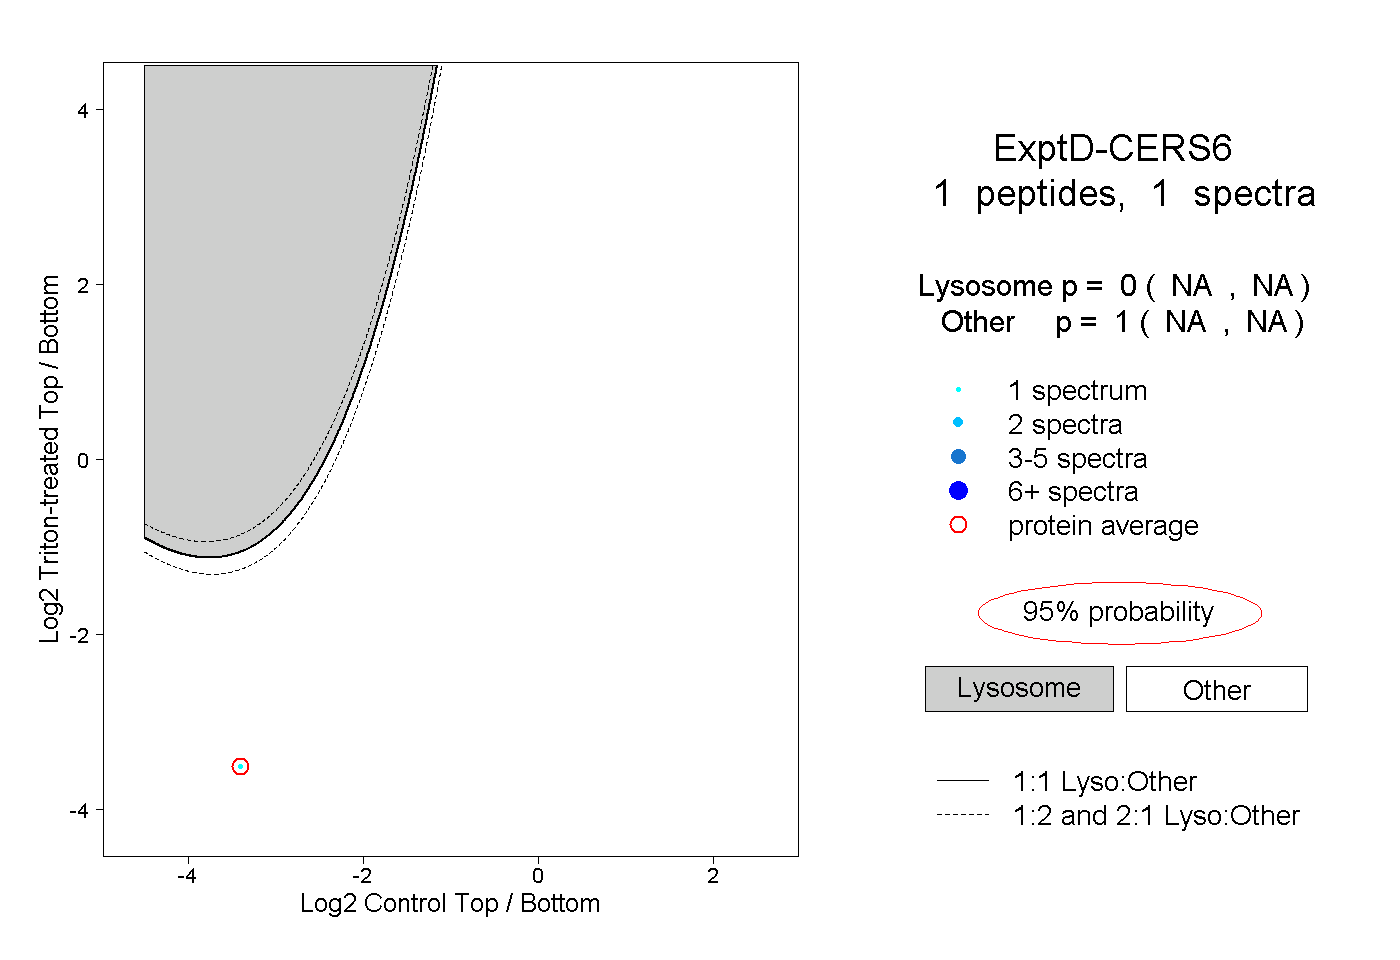 |
0.000 NA | NA |
1.000 NA | NA |