 2
2peptides
spectra
0.000 | 0.000
0.423 | 0.516
0.000 | 0.003
0.000 | 0.006
0.000 | 0.144
0.266 | 0.448
0.042 | 0.133
0.000 | 0.000
1peptide
spectra
NA | NA
NA | NA
| Plot | Mito | Lyso | Perox | ER | Golgi | PM | Cytosol | Nucleus | |||||
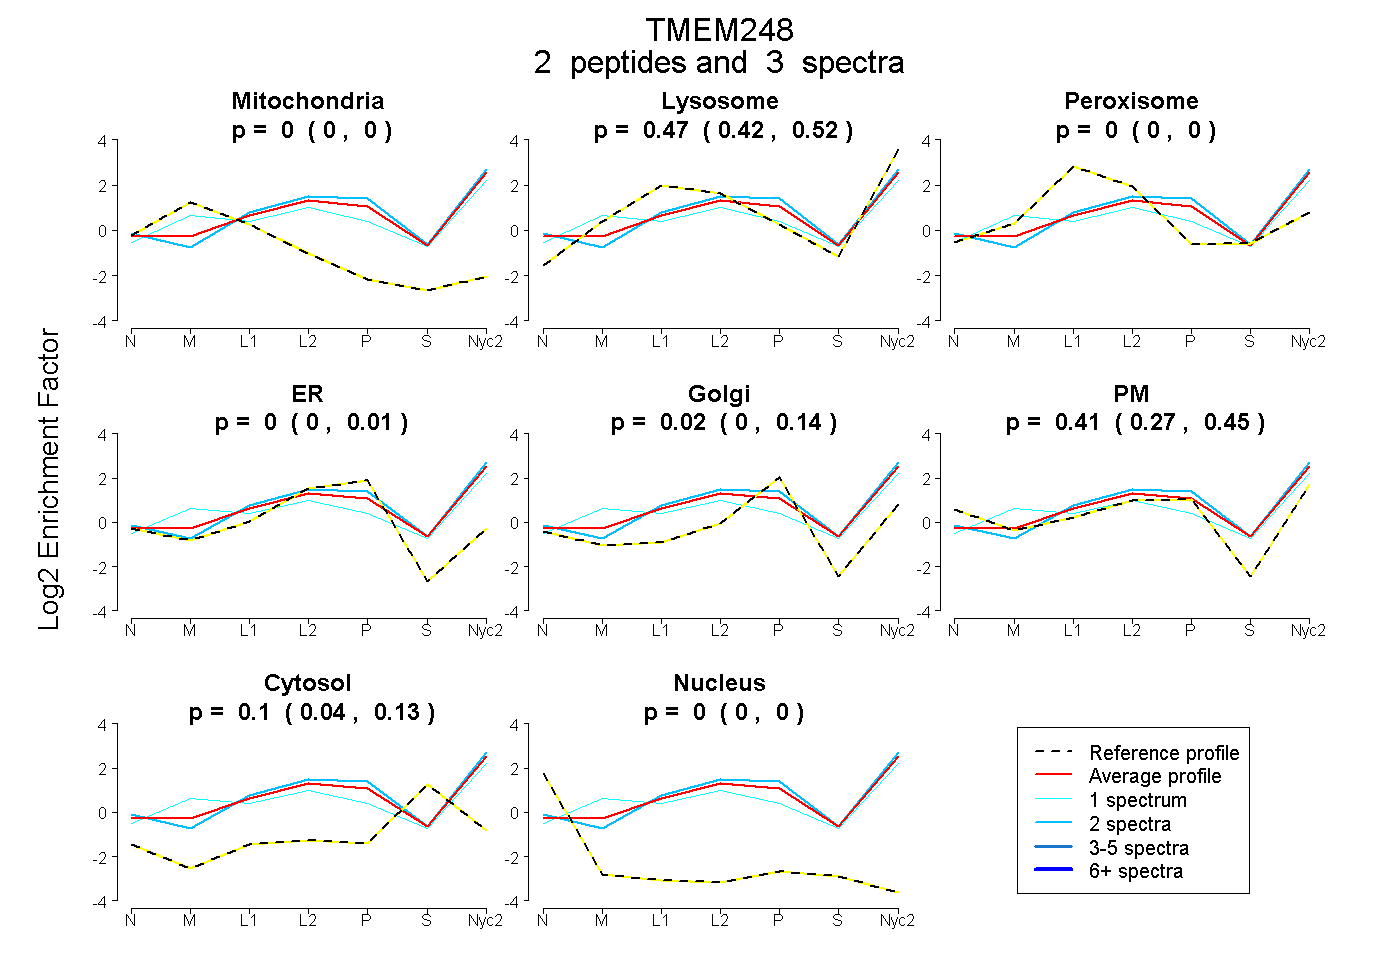
| Expt A |
2 peptides |
3 spectra |
|
0.000 0.000 | 0.000 |
0.471 0.423 | 0.516 |
0.000 0.000 | 0.003 |
0.000 0.000 | 0.006 |
0.018 0.000 | 0.144 |
0.412 0.266 | 0.448 |
0.099 0.042 | 0.133 |
0.000 0.000 | 0.000 |
||
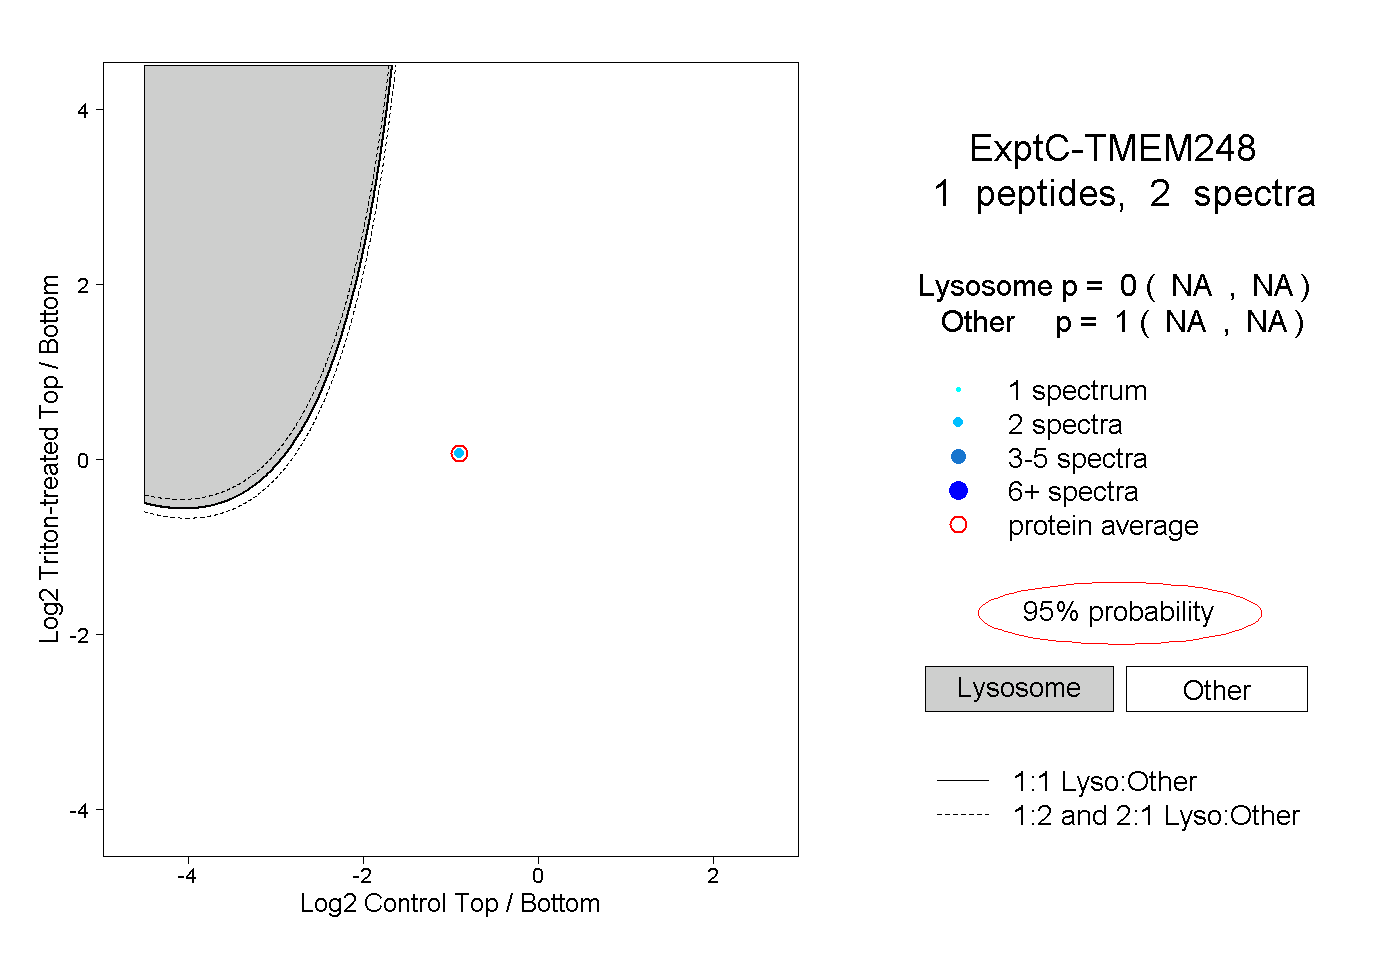
| Plot | Lyso | Other | |||||||||||
| Expt C |
1 peptide |
2 spectra |
|
0.000 NA | NA |
1.000 NA | NA |