 2
2peptides
spectra
0.000 | 0.106
0.000 | 0.096
0.000 | 0.113
0.000 | 0.038
0.000 | 0.134
0.000 | 0.091
0.756 | 0.902
0.000 | 0.012
3peptides
spectra
0.000 | 0.000
1.000 | 1.000
| Plot | Mito | Lyso | Perox | ER | Golgi | PM | Cytosol | Nucleus | |||||
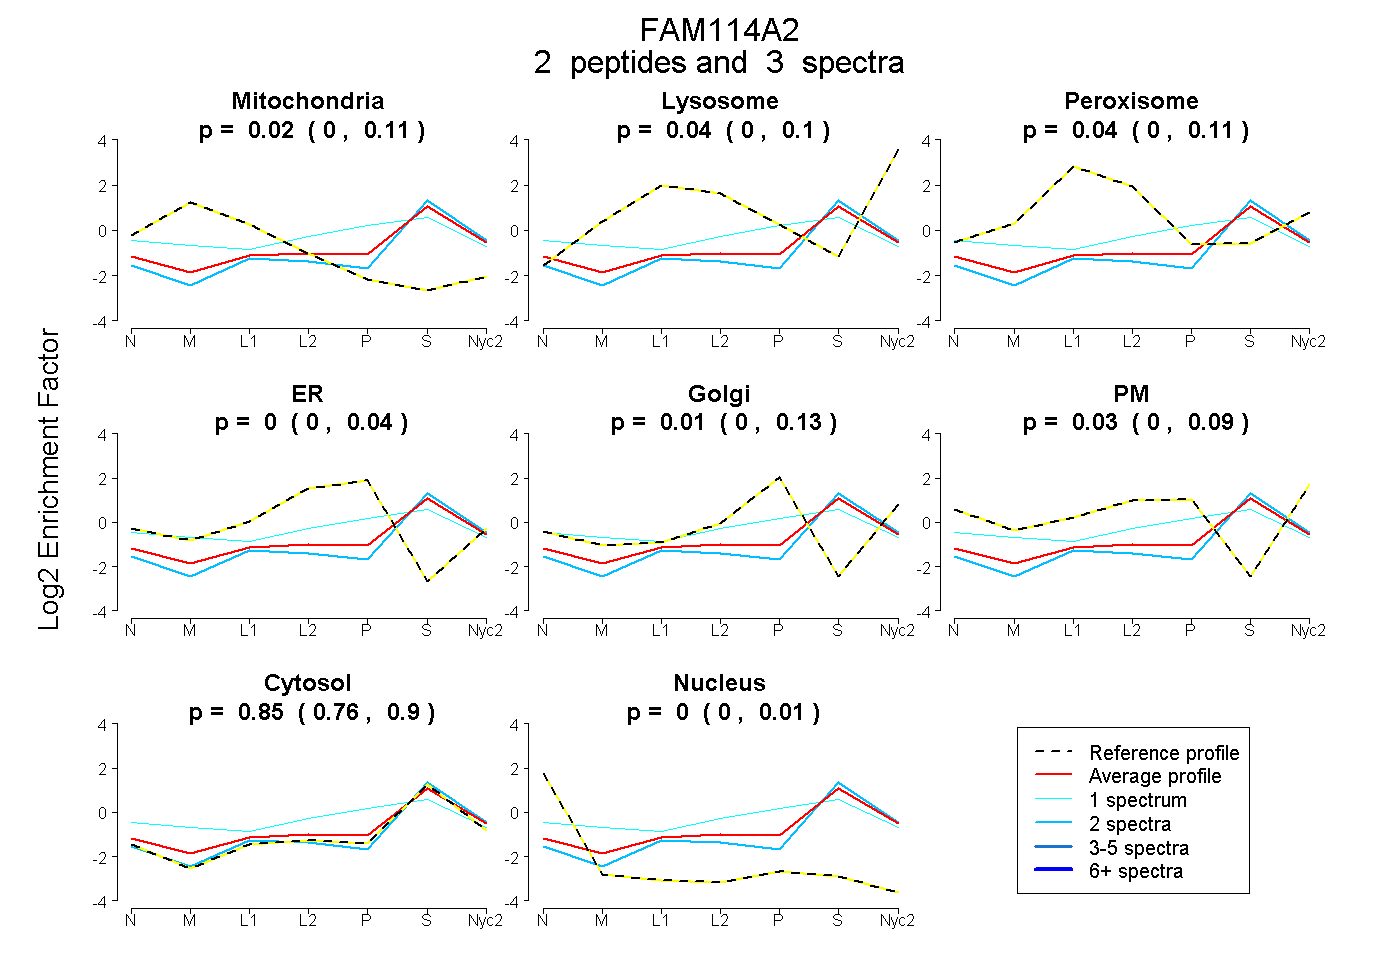
| Expt A |
2 peptides |
3 spectra |
|
0.024 0.000 | 0.106 |
0.036 0.000 | 0.096 |
0.042 0.000 | 0.113 |
0.000 0.000 | 0.038 |
0.013 0.000 | 0.134 |
0.032 0.000 | 0.091 |
0.852 0.756 | 0.902 |
0.000 0.000 | 0.012 |
||
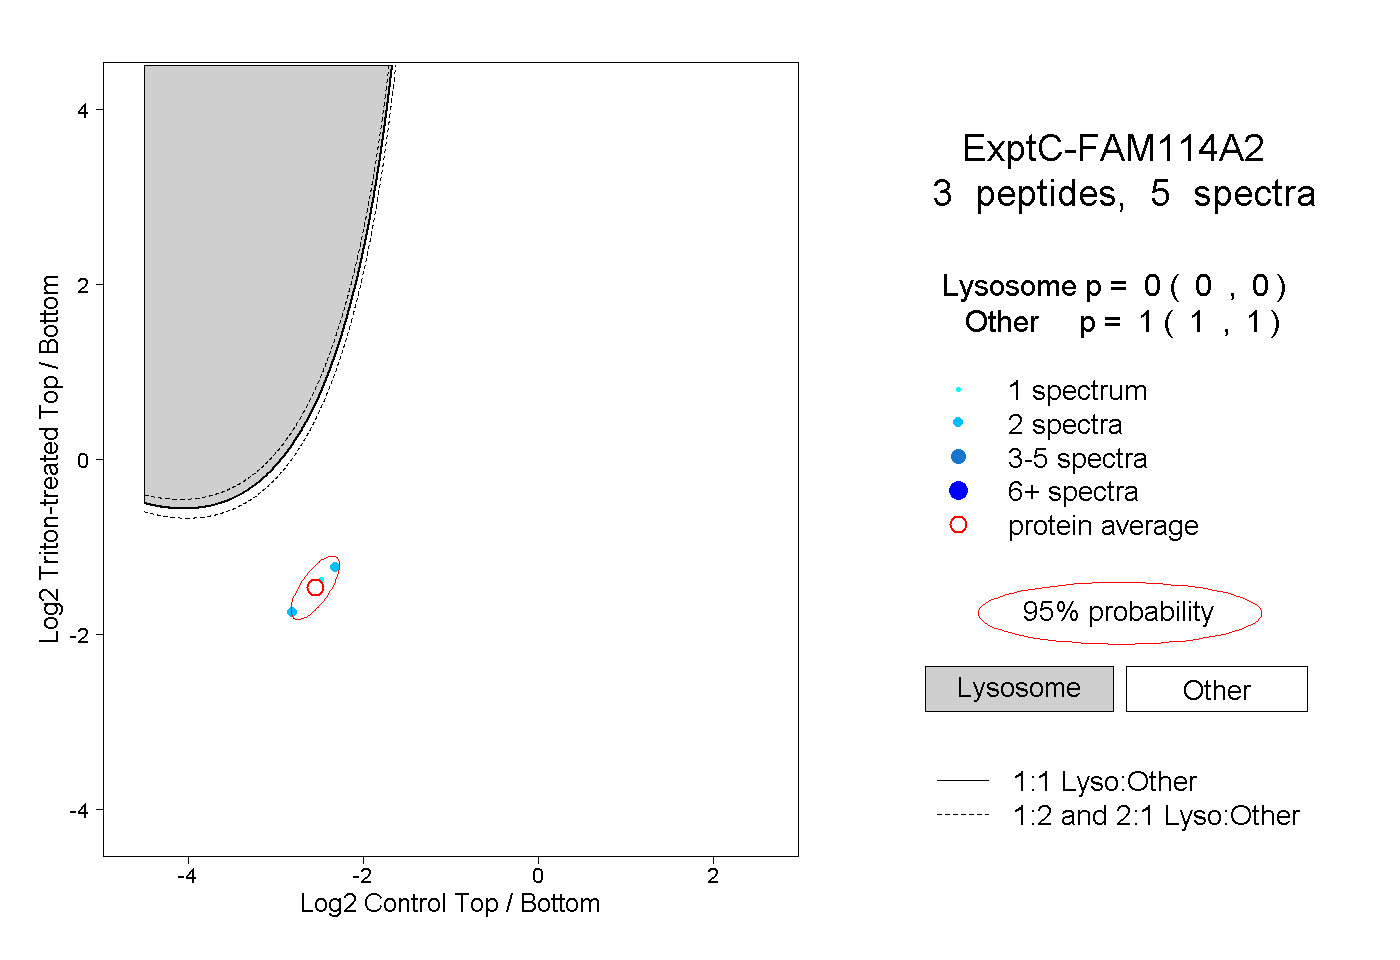
| Plot | Lyso | Other | |||||||||||
| Expt C |
3 peptides |
5 spectra |
|
0.000 0.000 | 0.000 |
1.000 1.000 | 1.000 |