 3
3peptides
spectra
0.000 | 0.058
0.000 | 0.000
0.000 | 0.000
0.000 | 0.227
0.000 | 0.247
0.000 | 0.000
0.485 | 0.597
0.146 | 0.353
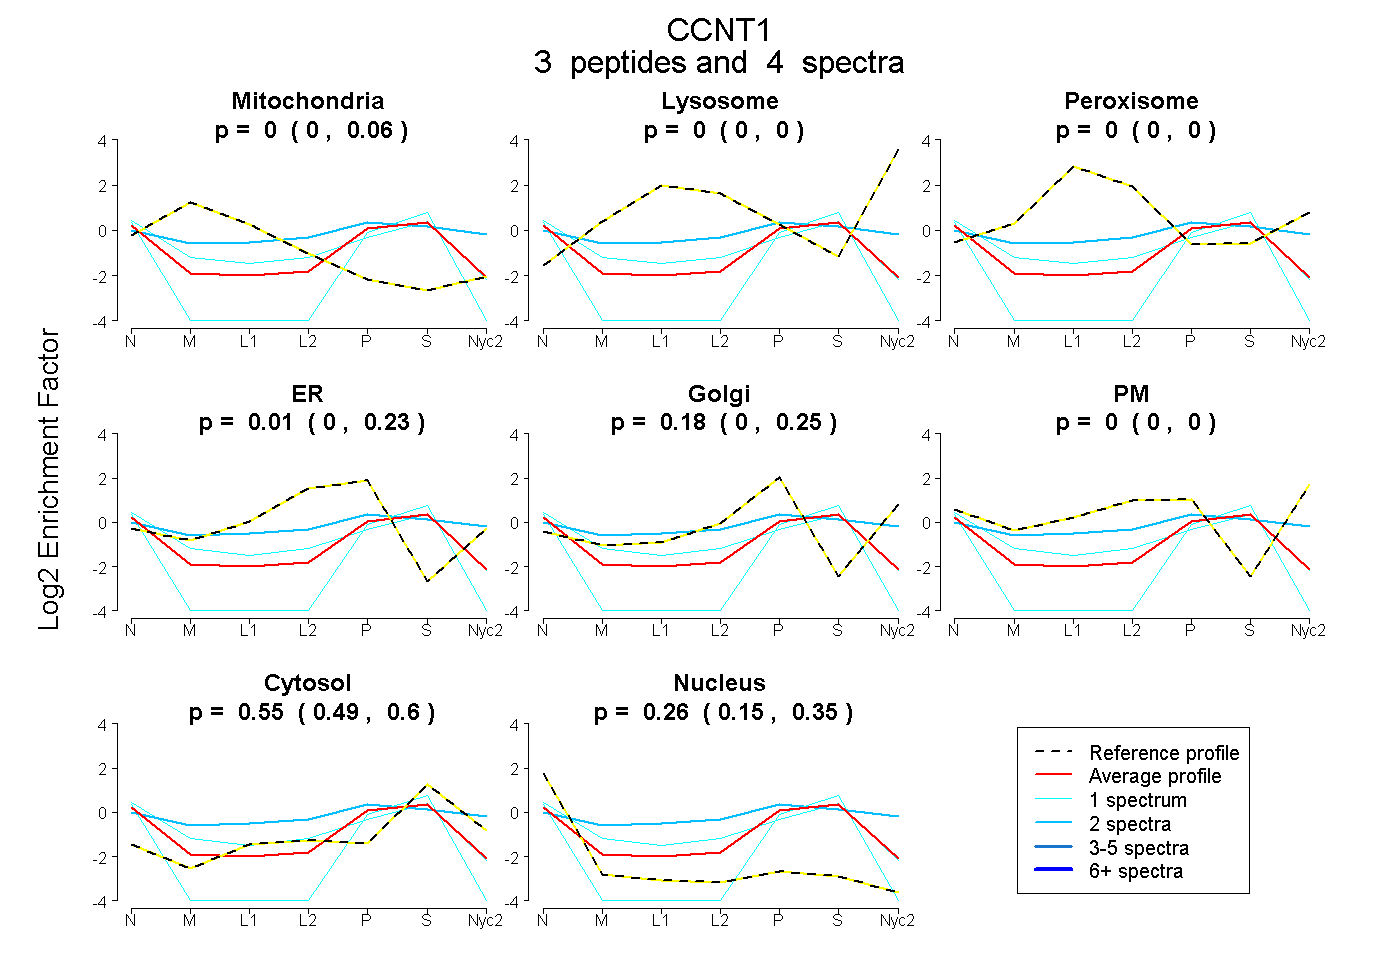
| Plot | Mito | Lyso | Perox | ER | Golgi | PM | Cytosol | Nucleus | |||||
| Expt A |
3 peptides |
4 spectra |
|
0.000 0.000 | 0.058 |
0.000 0.000 | 0.000 |
0.000 0.000 | 0.000 |
0.012 0.000 | 0.227 |
0.176 0.000 | 0.247 |
0.000 0.000 | 0.000 |
0.549 0.485 | 0.597 |
0.264 0.146 | 0.353 |
| 1 spectrum, YSMAPAALFLAAK | 0.000 | 0.000 | 0.000 | 0.000 | 0.000 | 0.000 | 0.429 | 0.571 | ||
| 2 spectra, VAHTCLHPQESLPDTR | 0.053 | 0.000 | 0.133 | 0.000 | 0.197 | 0.185 | 0.431 | 0.000 | ||
| 1 spectrum, EQLENSPSR | 0.085 | 0.000 | 0.000 | 0.187 | 0.000 | 0.000 | 0.525 | 0.202 |