 18
18peptides
spectra
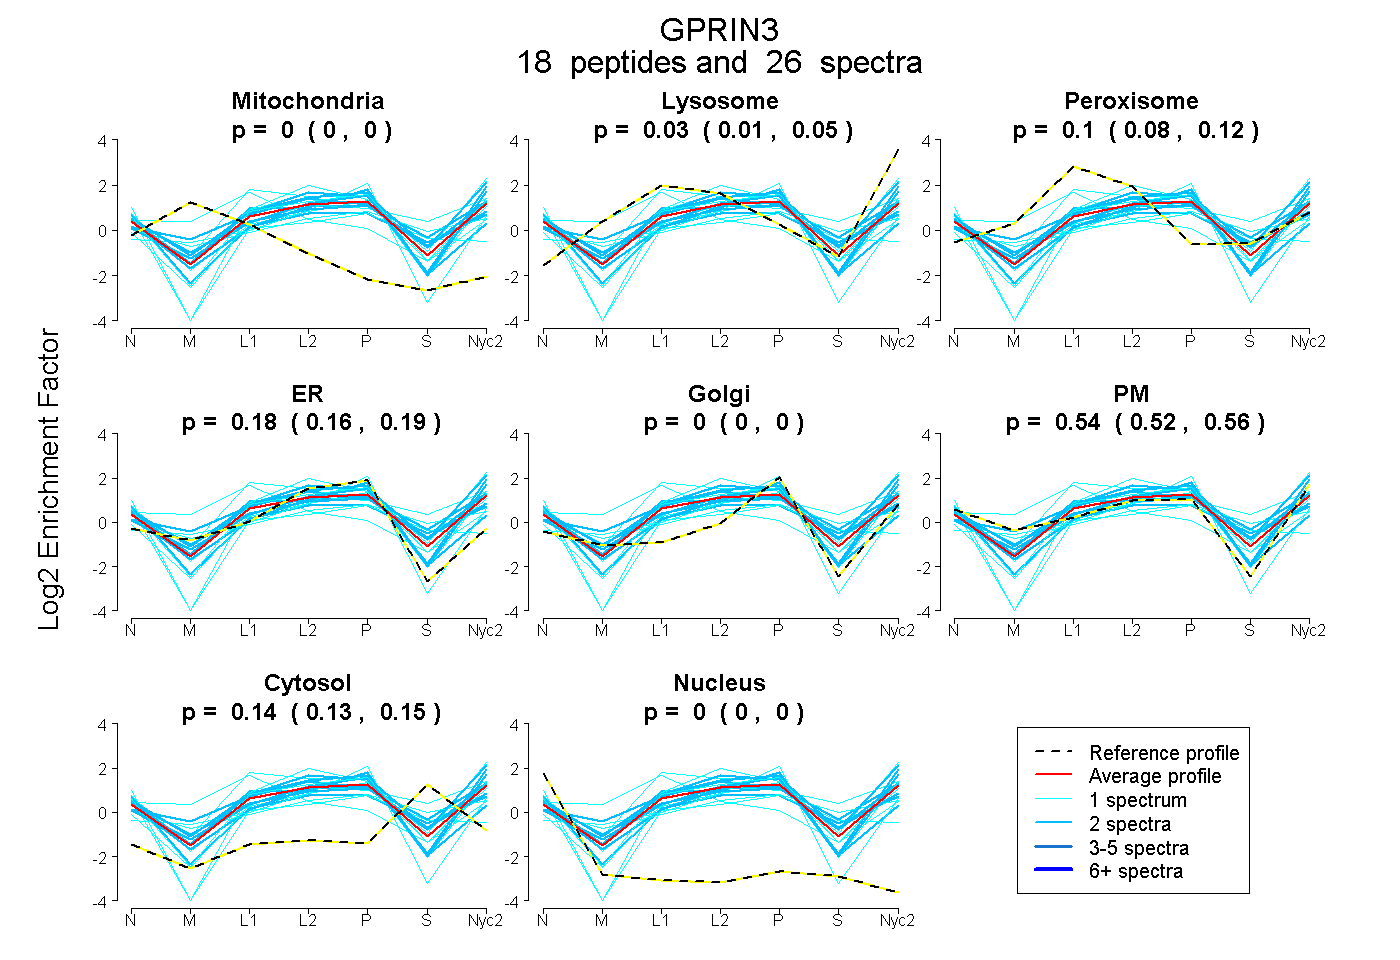
0.000 | 0.000
0.015 | 0.047
0.084 | 0.121
0.157 | 0.194
0.000 | 0.000
0.519 | 0.561
0.135 | 0.153
0.000 | 0.000
2peptides
spectra
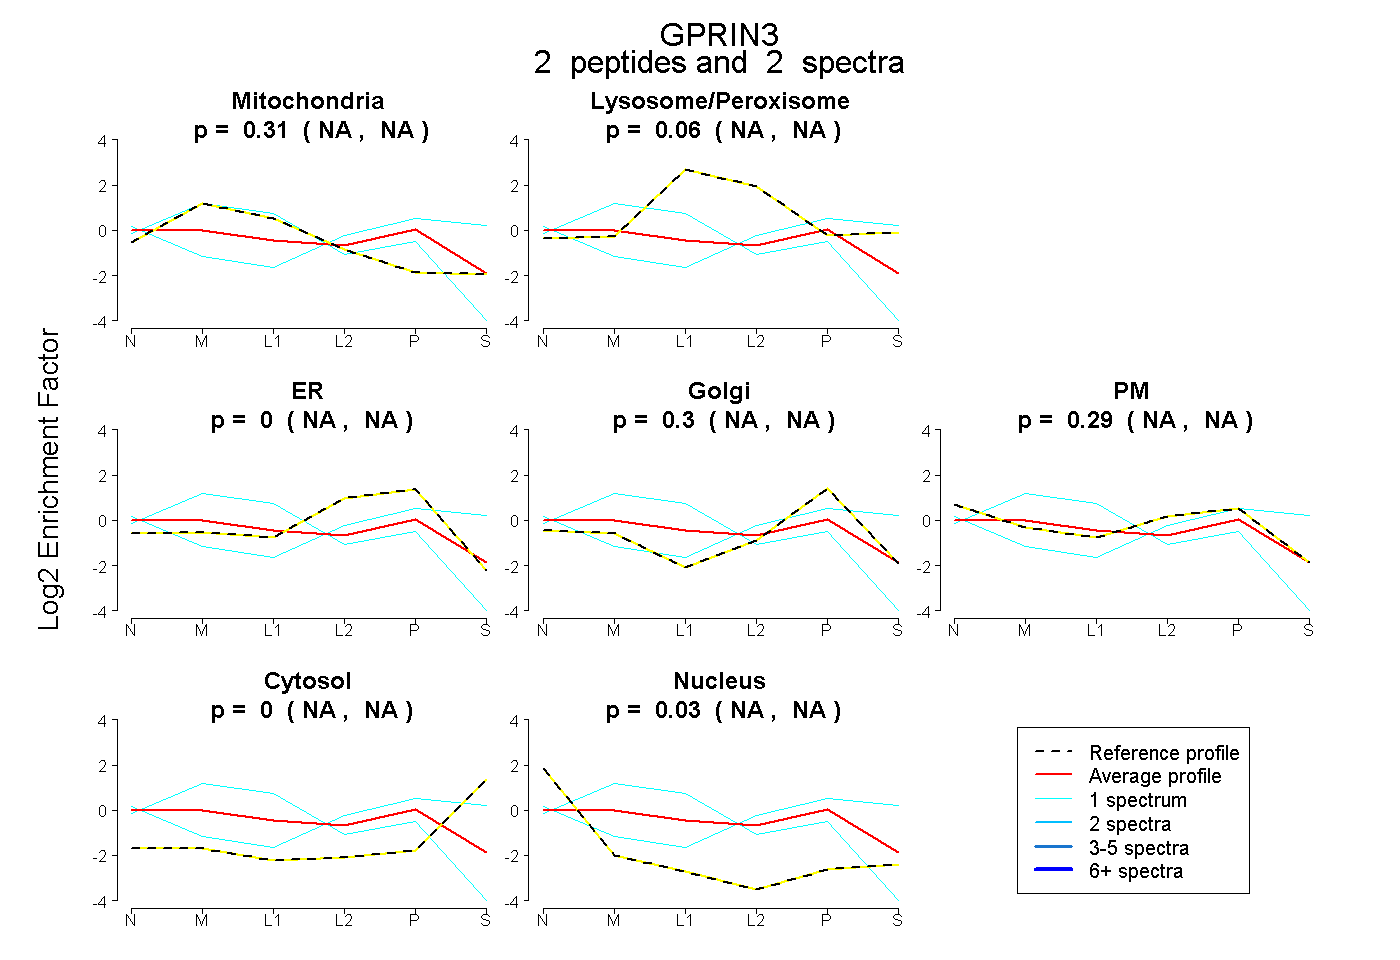
NA | NA
NA | NA
NA | NA
NA | NA
NA | NA
NA | NA
NA | NA
14peptides
spectra
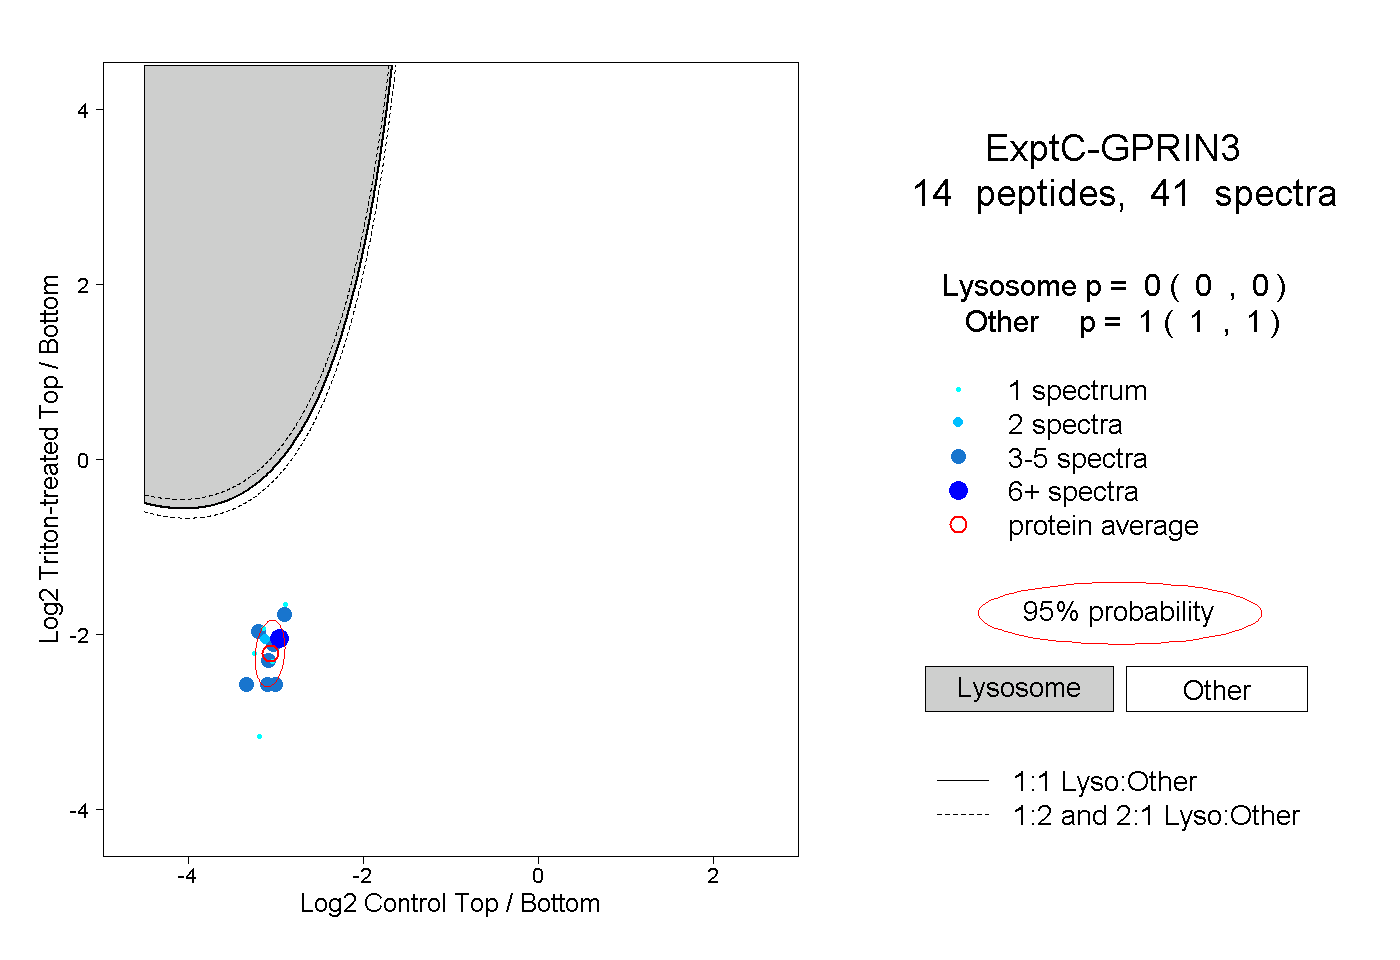
0.000 | 0.000
1.000 | 1.000
6peptides
spectra
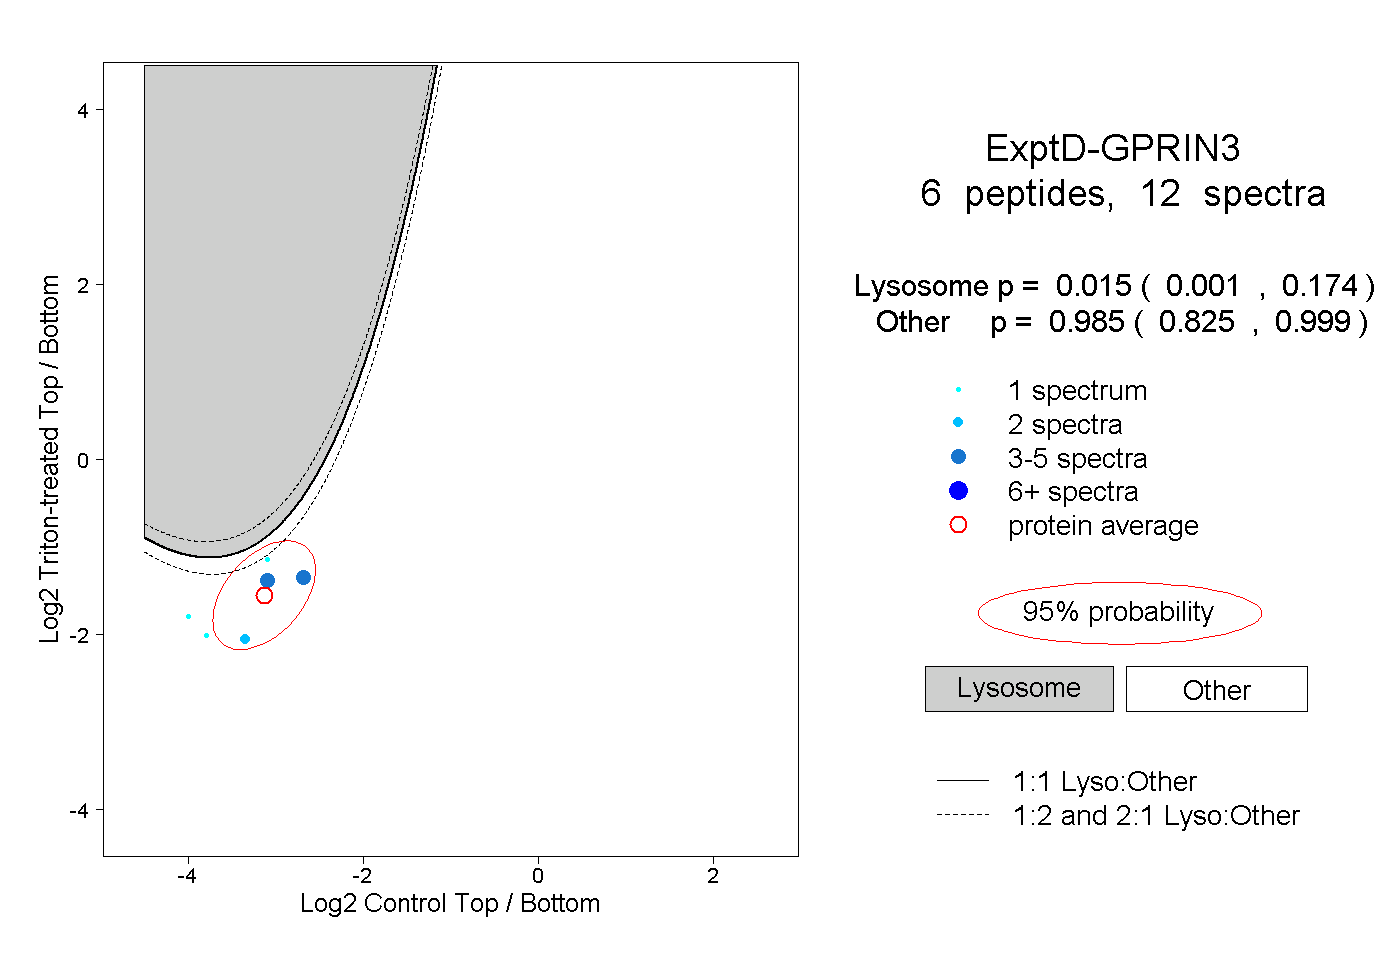
0.001 | 0.174
0.825 | 0.999