 2
2peptides
spectra
0.000 | 0.000
0.000 | 0.000
0.000 | 0.065
0.000 | 0.215
0.170 | 0.416
0.344 | 0.566
0.000 | 0.130
0.009 | 0.098
1peptide
spectra
NA | NA
NA | NA
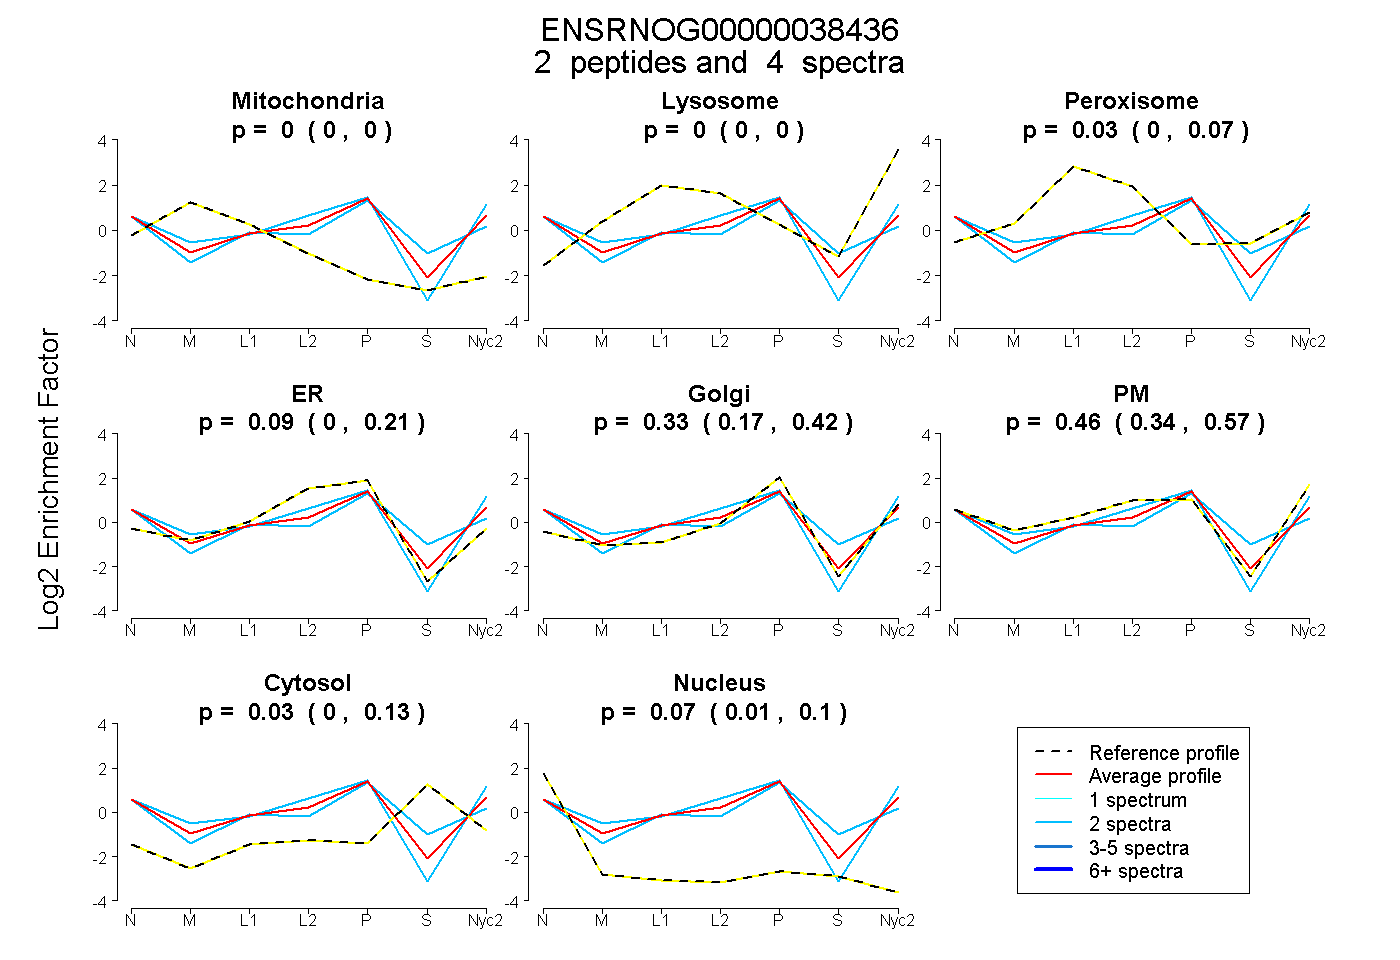
| Plot | Mito | Lyso | Perox | ER | Golgi | PM | Cytosol | Nucleus | |||||
| Expt A |
2 peptides |
4 spectra |
|
0.000 0.000 | 0.000 |
0.000 0.000 | 0.000 |
0.027 0.000 | 0.065 |
0.087 0.000 | 0.215 |
0.327 0.170 | 0.416 |
0.463 0.344 | 0.566 |
0.025 0.000 | 0.130 |
0.071 0.009 | 0.098 |
||
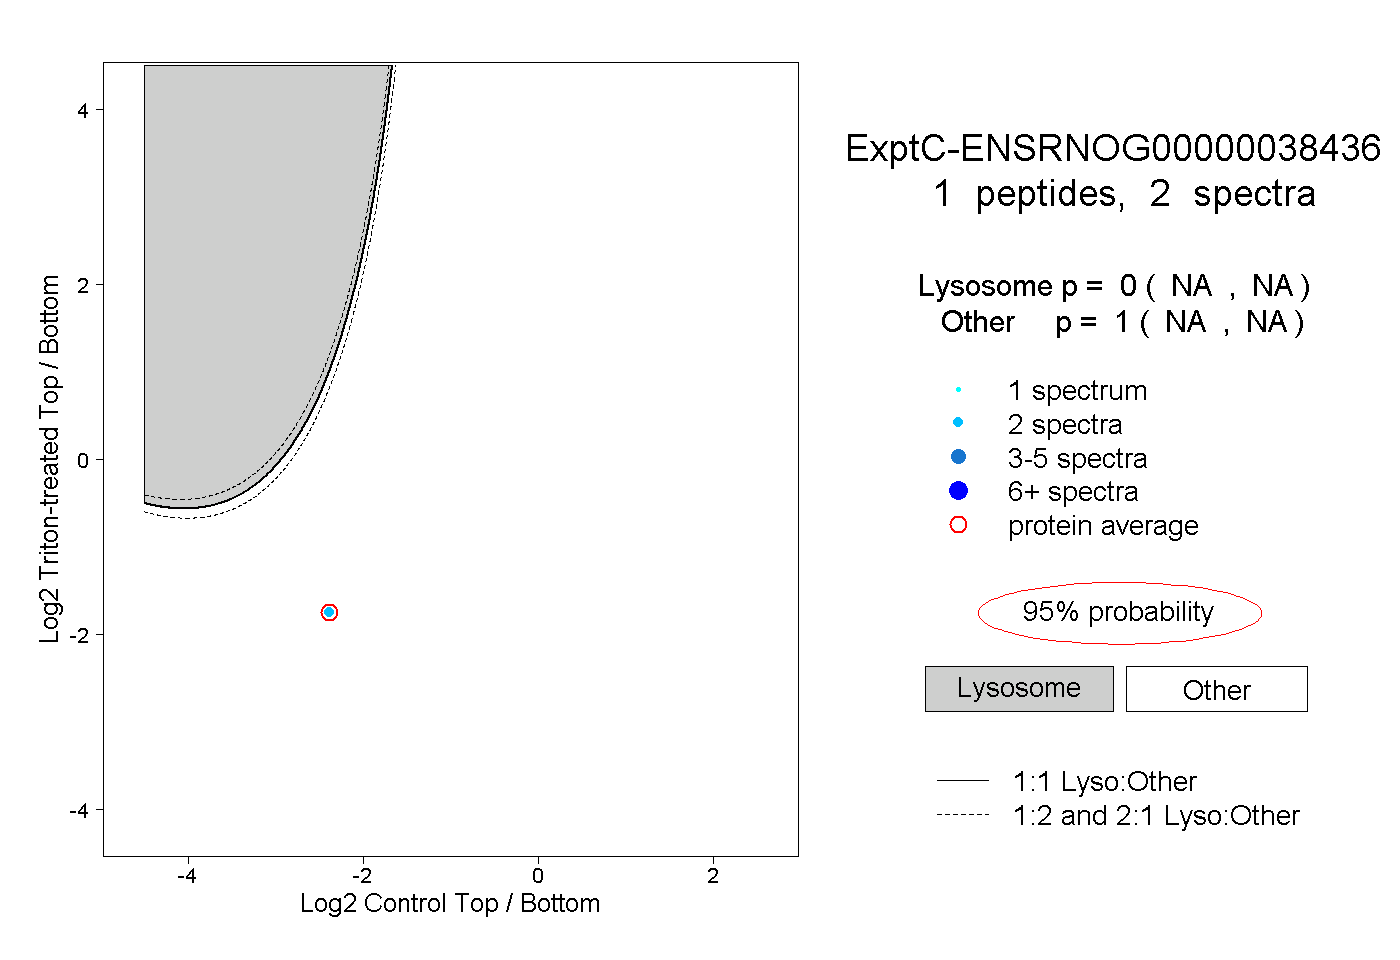
| Plot | Lyso | Other | |||||||||||
| Expt C |
1 peptide |
2 spectra |
|
0.000 NA | NA |
1.000 NA | NA |