13
13peptides
spectra
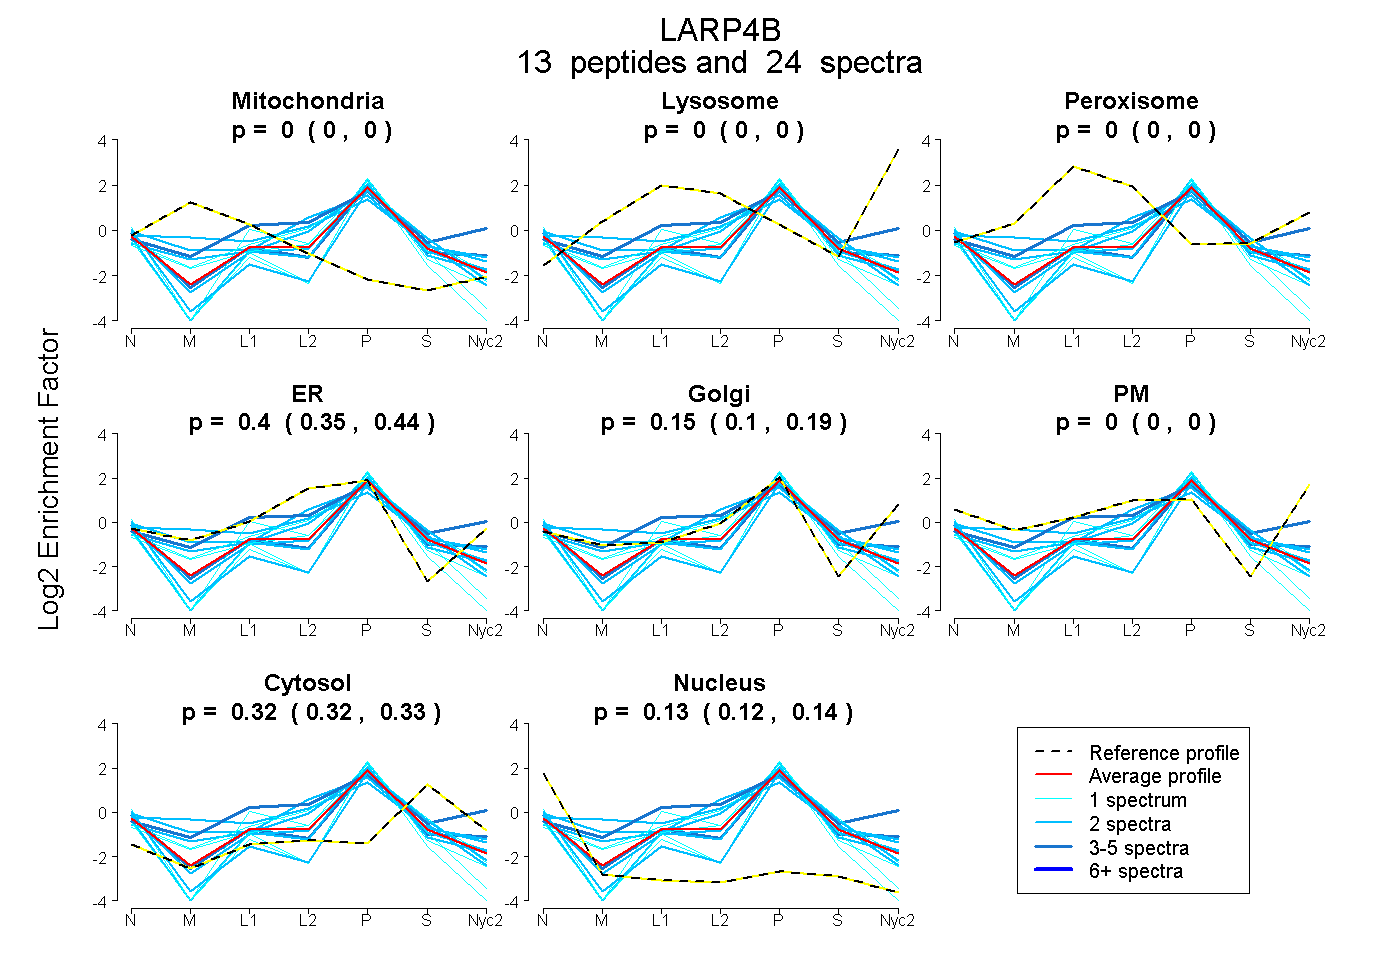
0.000 | 0.000
0.000 | 0.000
0.000 | 0.000
0.353 | 0.438
0.100 | 0.194
0.000 | 0.000
0.315 | 0.332
0.115 | 0.135
6peptides
spectra
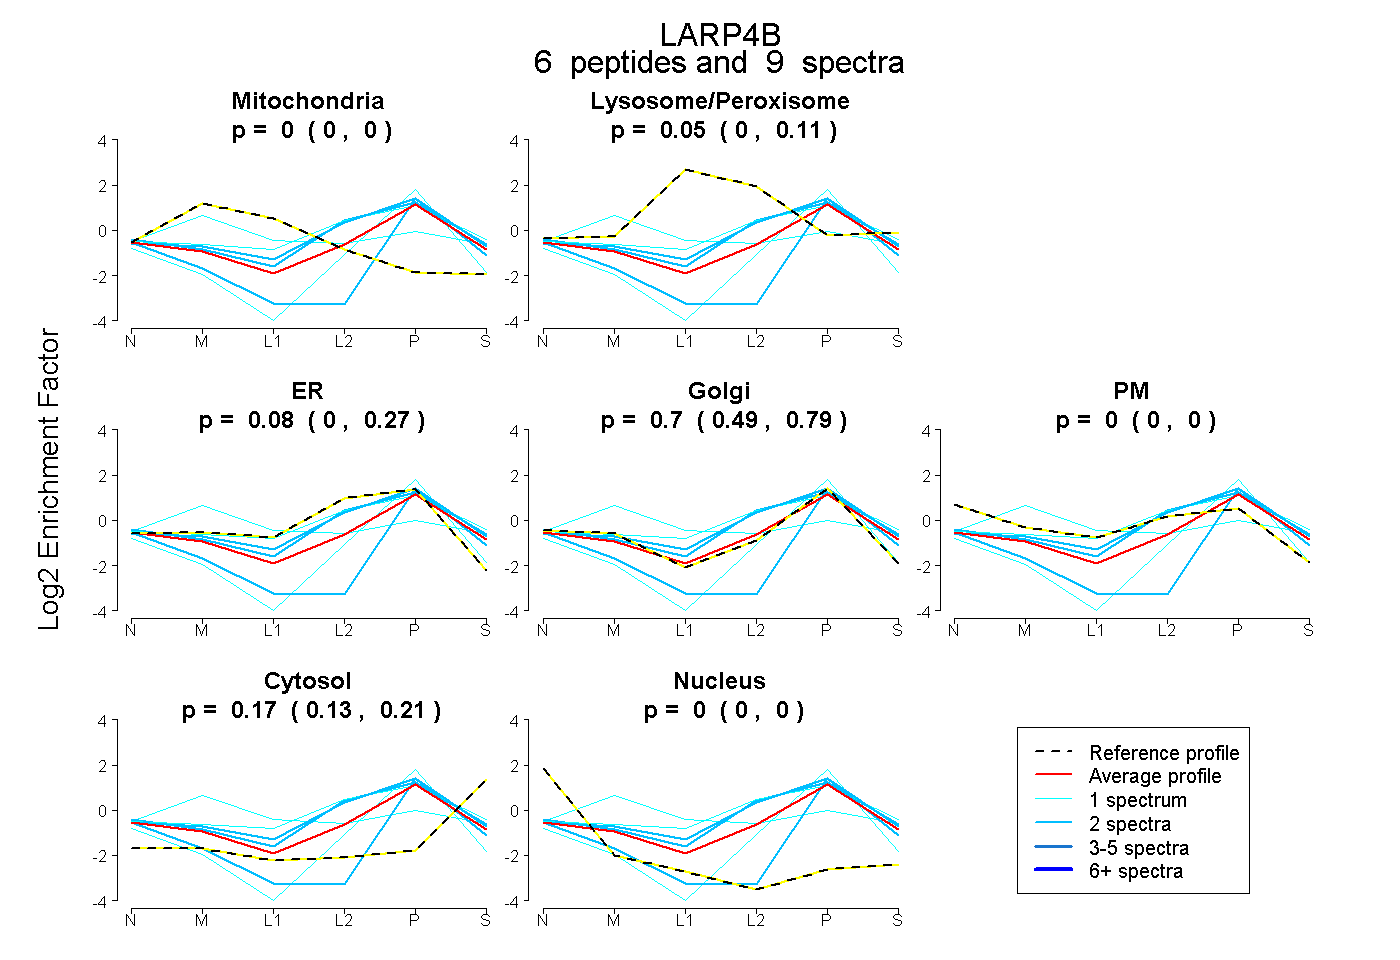
0.000 | 0.000
0.000 | 0.111
0.000 | 0.275
0.487 | 0.794
0.000 | 0.000
0.131 | 0.209
0.000 | 0.000
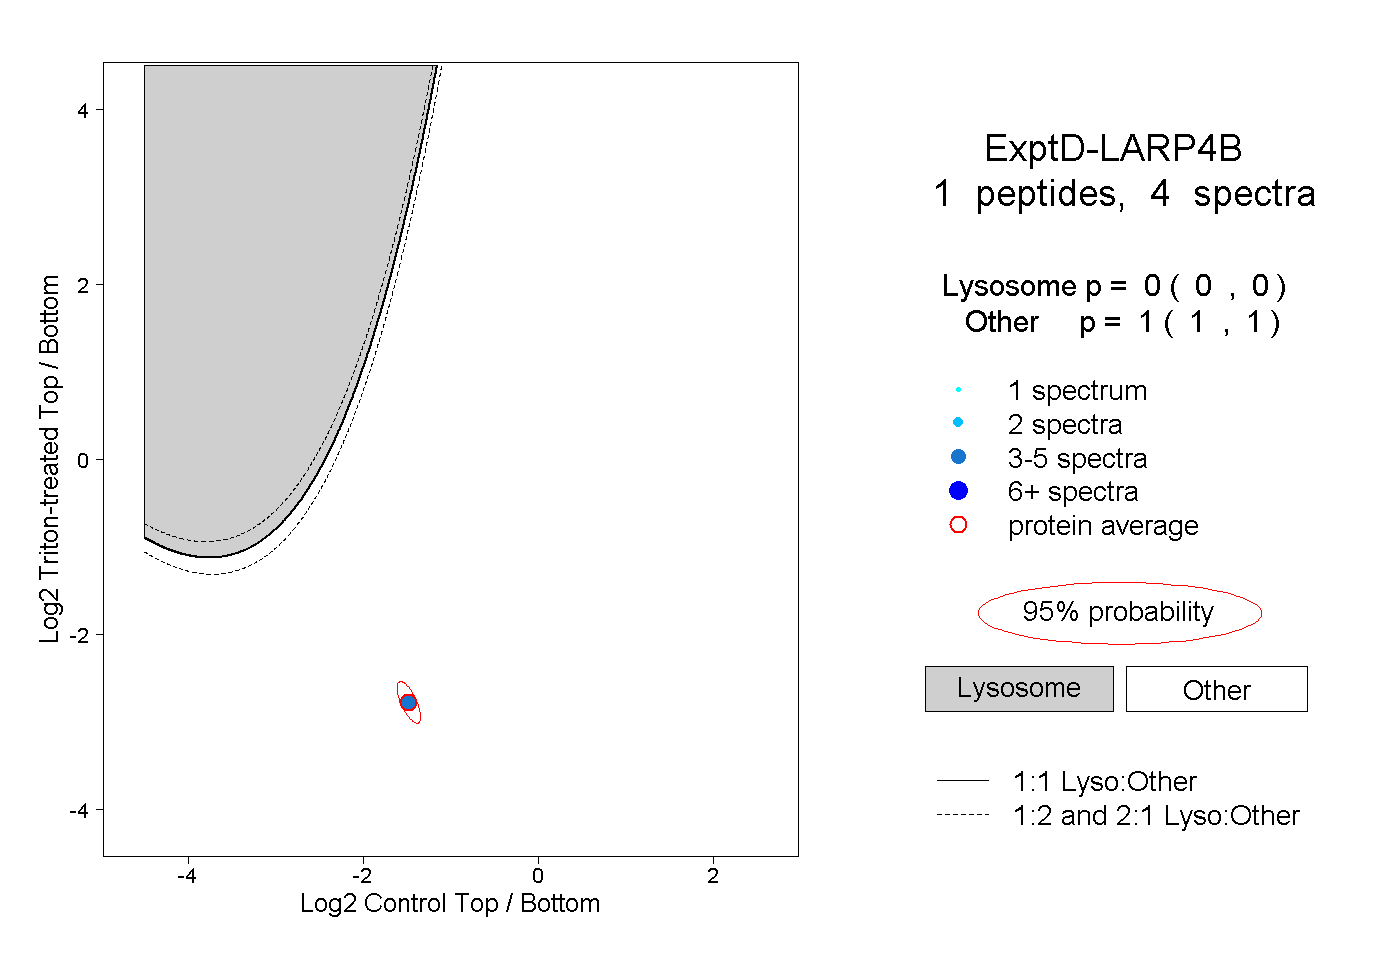
10peptides
spectra
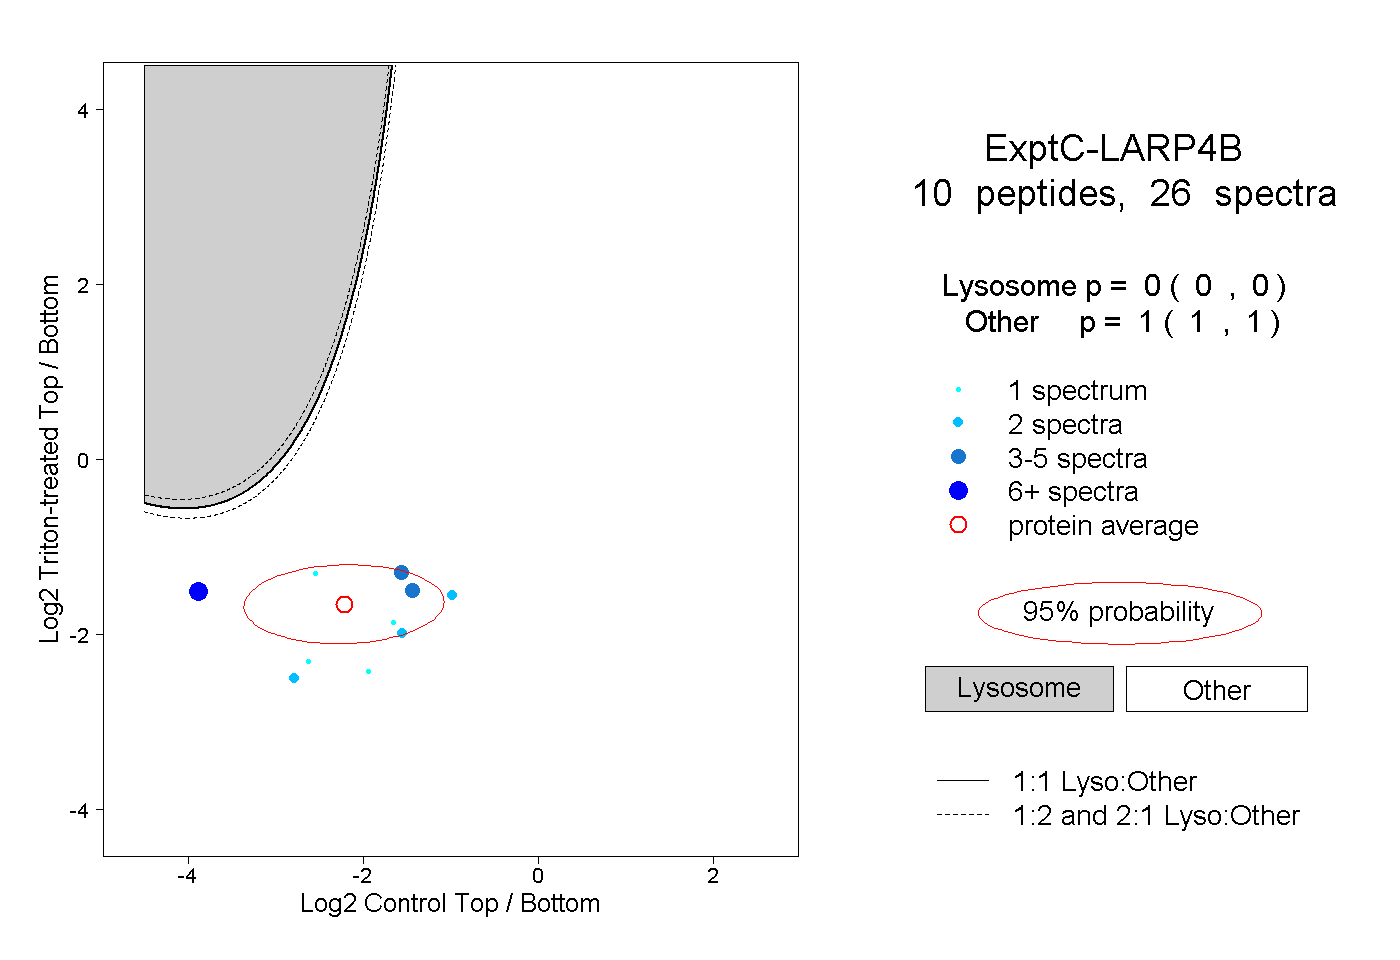
0.000 | 0.000
1.000 | 1.000