 13
13peptides
spectra
0.000 | 0.000
0.000 | 0.000
0.000 | 0.000
0.353 | 0.438
0.100 | 0.194
0.000 | 0.000
0.315 | 0.332
0.115 | 0.135
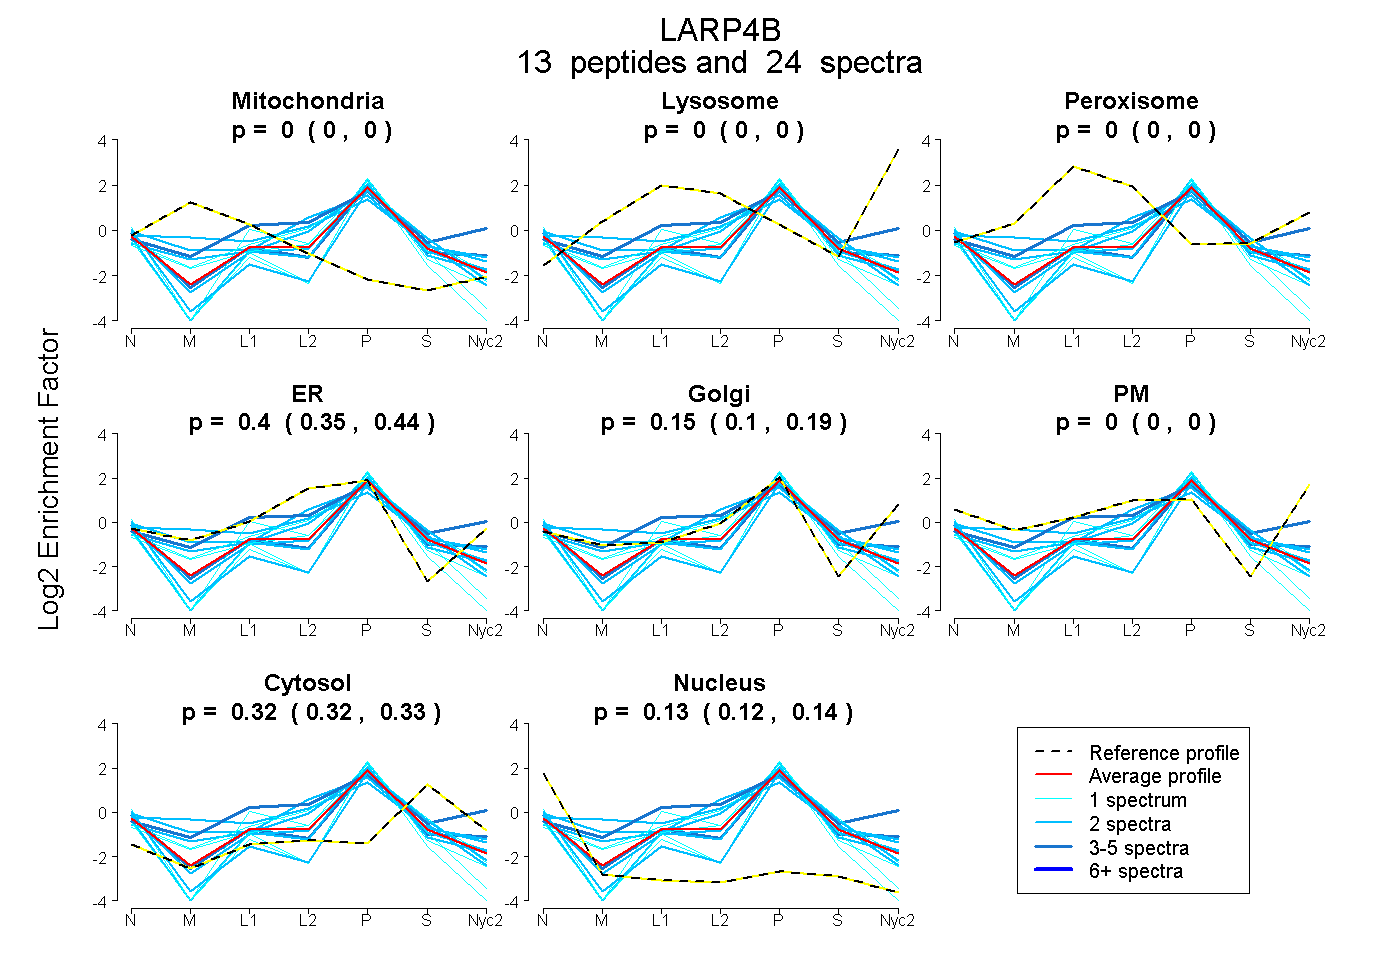
| Plot | Mito | Lyso | Perox | ER | Golgi | PM | Cytosol | Nucleus | |||||
| Expt A |
13 peptides |
24 spectra |
|
0.000 0.000 | 0.000 |
0.000 0.000 | 0.000 |
0.000 0.000 | 0.000 |
0.399 0.353 | 0.438 |
0.150 0.100 | 0.194 |
0.000 0.000 | 0.000 |
0.325 0.315 | 0.332 |
0.127 0.115 | 0.135 |
| 2 spectra, GDNLPK | 0.111 | 0.000 | 0.000 | 0.597 | 0.000 | 0.000 | 0.292 | 0.000 | ||
| 1 spectrum, SLPLVQVDEK | 0.000 | 0.000 | 0.000 | 0.585 | 0.000 | 0.000 | 0.391 | 0.024 | ||
| 2 spectra, LAEPAER | 0.000 | 0.000 | 0.000 | 0.295 | 0.273 | 0.000 | 0.285 | 0.147 | ||
| 2 spectra, VVAEPQAQR | 0.000 | 0.000 | 0.000 | 0.000 | 0.354 | 0.000 | 0.384 | 0.262 | ||
| 1 spectrum, EPSVPAPCAVSAAFER | 0.000 | 0.000 | 0.000 | 0.000 | 0.461 | 0.000 | 0.245 | 0.293 | ||
| 2 spectra, EAHSVDR | 0.000 | 0.000 | 0.000 | 0.150 | 0.383 | 0.000 | 0.284 | 0.184 | ||
| 2 spectra, HAIPSTER | 0.000 | 0.000 | 0.000 | 0.671 | 0.000 | 0.000 | 0.301 | 0.027 | ||
| 1 spectrum, VSELNPNAK | 0.000 | 0.000 | 0.000 | 0.500 | 0.000 | 0.000 | 0.420 | 0.080 | ||
| 4 spectra, AEDLFENR | 0.000 | 0.000 | 0.000 | 0.076 | 0.536 | 0.000 | 0.271 | 0.117 | ||
| 2 spectra, LSTDVDLIVEVLR | 0.000 | 0.000 | 0.000 | 0.582 | 0.000 | 0.000 | 0.331 | 0.087 | ||
| 3 spectra, TLEFCLSR | 0.000 | 0.000 | 0.183 | 0.237 | 0.365 | 0.000 | 0.216 | 0.000 | ||
| 1 spectrum, KPSYAEICQR | 0.000 | 0.000 | 0.000 | 0.547 | 0.000 | 0.000 | 0.119 | 0.335 | ||
| 1 spectrum, SLSTDASTNTAPVVVPR | 0.000 | 0.000 | 0.000 | 0.187 | 0.167 | 0.000 | 0.312 | 0.333 |
| Plot | Mito | Lyso or Perox | ER | Golgi | PM | Cytosol | Nucleus | ||||||
| Expt B |
6 peptides |
9 spectra |
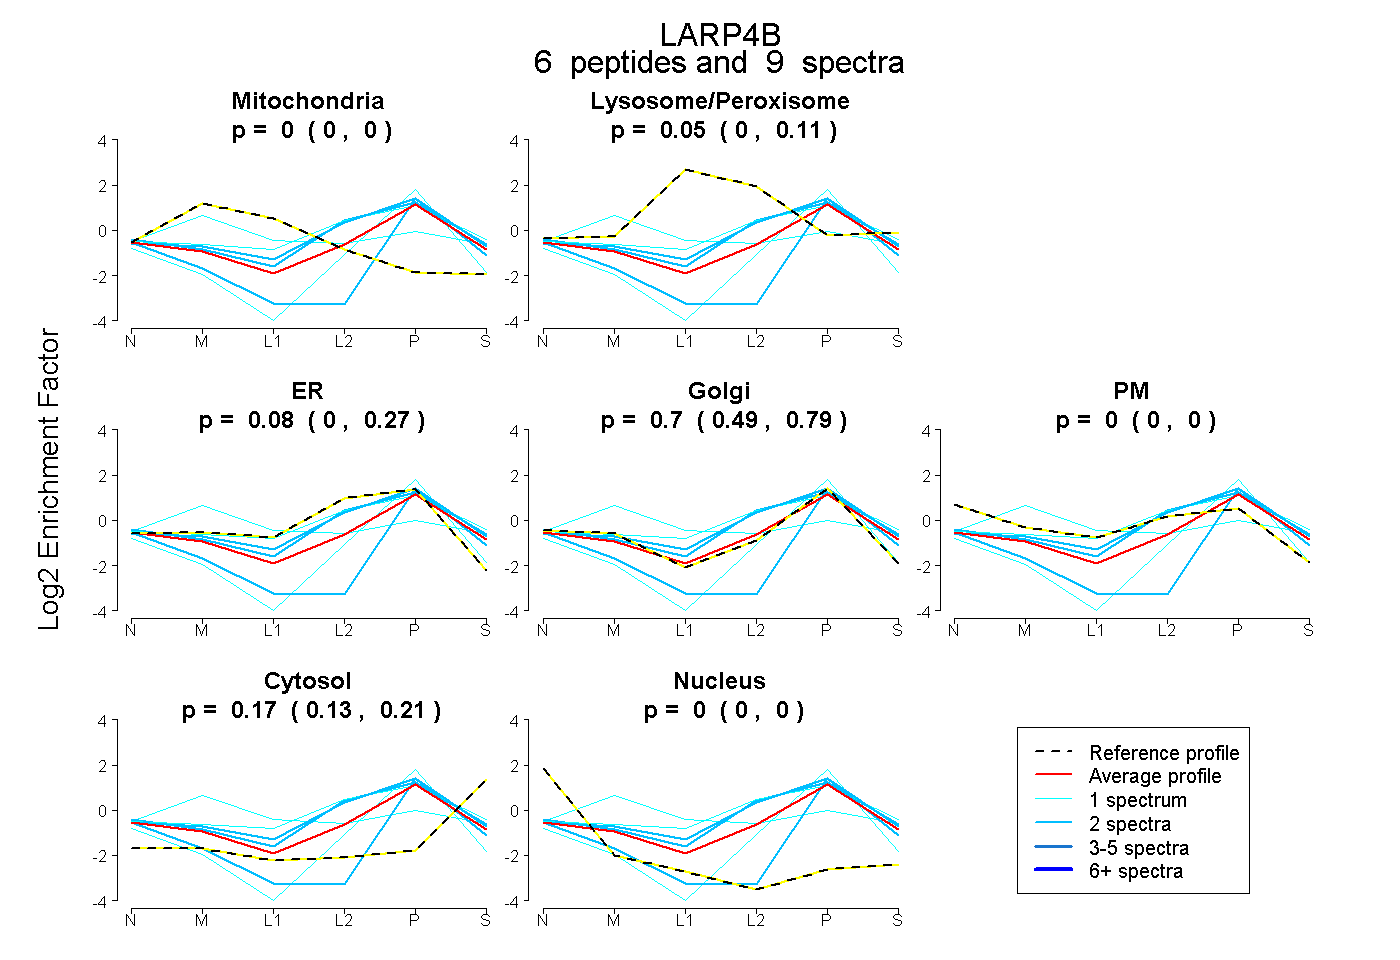 |
0.000 0.000 | 0.000 |
0.049 0.000 | 0.111 |
0.077 0.000 | 0.275 |
0.702 0.487 | 0.794 |
0.000 0.000 | 0.000 |
0.172 0.131 | 0.209 |
0.000 0.000 | 0.000 |
|||
| Plot | Lyso | Other | |||||||||||
| Expt C |
10 peptides |
26 spectra |
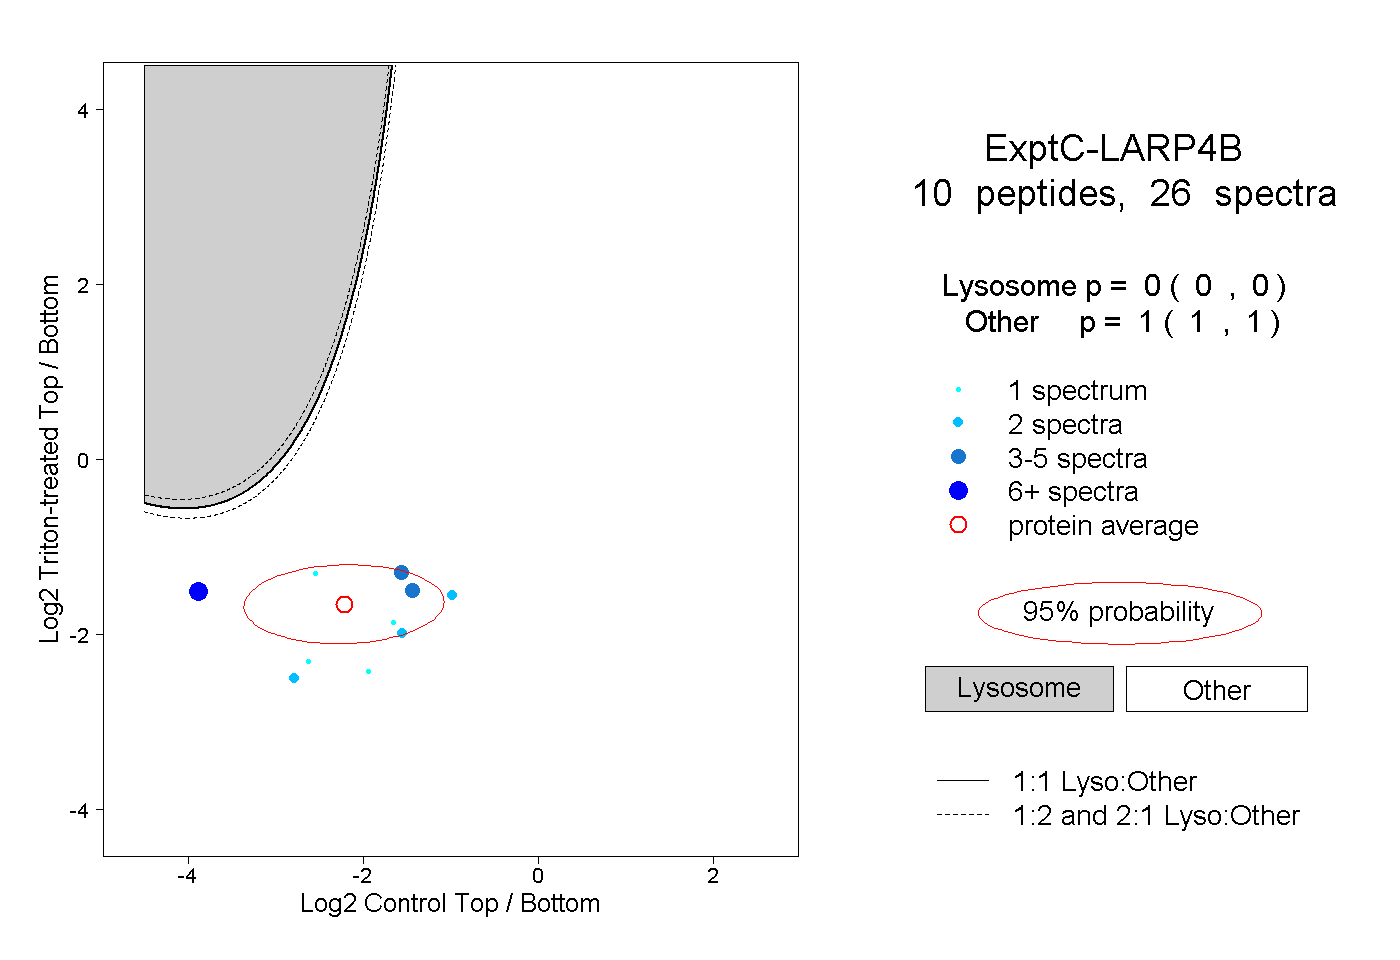 |
0.000 0.000 | 0.000 |
1.000 1.000 | 1.000 |
||||||||
| Plot | Lyso | Other | |||||||||||
| Expt D |
1 peptide |
4 spectra |
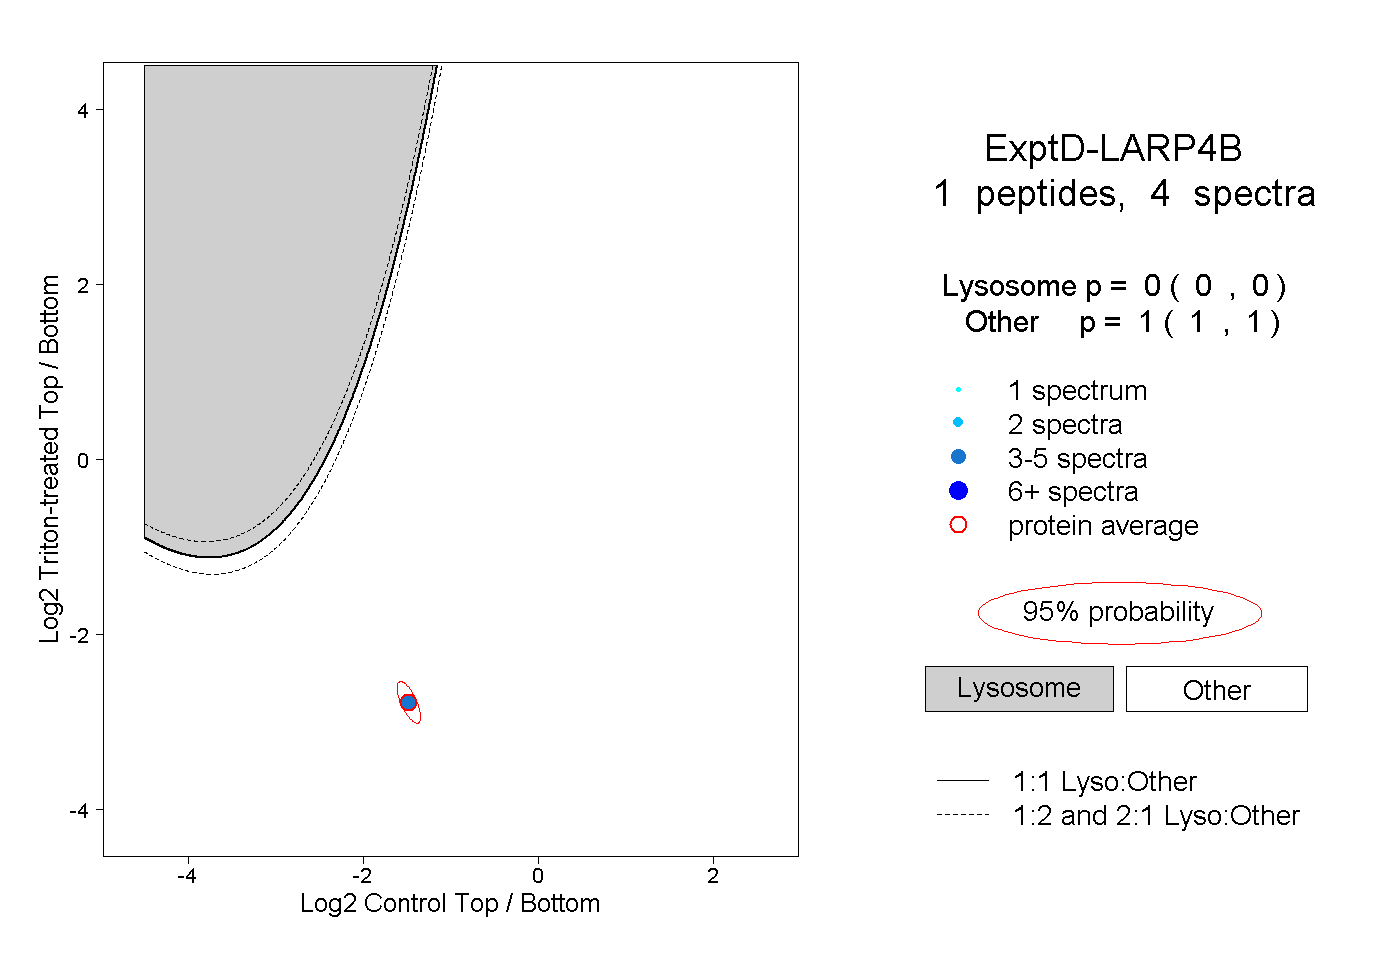 |
0.000 0.000 | 0.000 |
1.000 1.000 | 1.000 |