 11
11peptides
spectra
0.000 | 0.000
0.399 | 0.408
0.000 | 0.000
0.000 | 0.000
0.057 | 0.063
0.000 | 0.000
0.532 | 0.538
0.000 | 0.000
| Plot | Mito | Lyso | Perox | ER | Golgi | PM | Cytosol | Nucleus | |||||
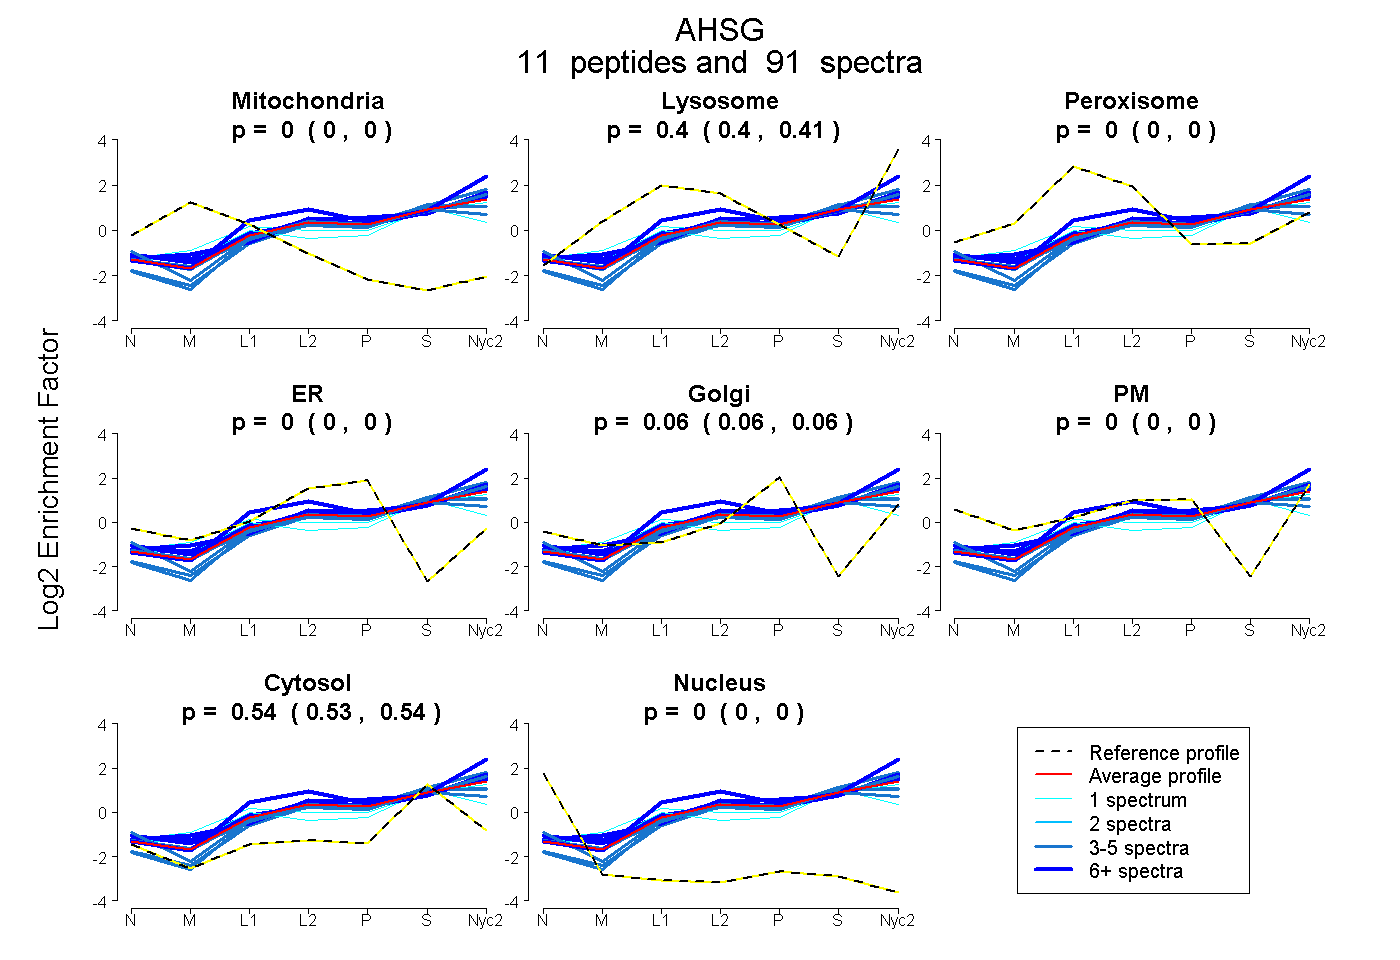
| Expt A |
11 peptides |
91 spectra |
|
0.000 0.000 | 0.000 |
0.404 0.399 | 0.408 |
0.000 0.000 | 0.000 |
0.000 0.000 | 0.000 |
0.060 0.057 | 0.063 |
0.000 0.000 | 0.000 |
0.536 0.532 | 0.538 |
0.000 0.000 | 0.000 |
| 4 spectra, LGGEEVSVACK | 0.000 | 0.366 | 0.000 | 0.000 | 0.048 | 0.000 | 0.586 | 0.000 | ||
| 29 spectra, ATLIHR | 0.000 | 0.429 | 0.000 | 0.000 | 0.075 | 0.000 | 0.496 | 0.000 | ||
| 20 spectra, HLLQGFR | 0.000 | 0.437 | 0.000 | 0.000 | 0.085 | 0.000 | 0.479 | 0.000 | ||
| 5 spectra, QILNQIDK | 0.000 | 0.405 | 0.000 | 0.000 | 0.080 | 0.000 | 0.515 | 0.000 | ||
| 5 spectra, LVEISR | 0.000 | 0.405 | 0.000 | 0.000 | 0.000 | 0.000 | 0.595 | 0.000 | ||
| 1 spectrum, ELACDDPETEHVALIAVDYLNK | 0.000 | 0.464 | 0.000 | 0.000 | 0.003 | 0.000 | 0.533 | 0.000 | ||
| 1 spectrum, HAFSPVASVESASGEVLHSPK | 0.000 | 0.213 | 0.122 | 0.000 | 0.029 | 0.000 | 0.636 | 0.000 | ||
| 6 spectra, QDGQFR | 0.000 | 0.416 | 0.000 | 0.000 | 0.132 | 0.000 | 0.451 | 0.000 | ||
| 11 spectra, THHDLR | 0.000 | 0.591 | 0.000 | 0.000 | 0.000 | 0.000 | 0.409 | 0.000 | ||
| 5 spectra, QQAEHAVEGDCDFHILK | 0.000 | 0.268 | 0.000 | 0.133 | 0.000 | 0.000 | 0.599 | 0.000 | ||
| 4 spectra, CPILIR | 0.000 | 0.316 | 0.000 | 0.000 | 0.034 | 0.000 | 0.650 | 0.000 |
| Plot | Mito | Lyso or Perox | ER | Golgi | PM | Cytosol | Nucleus | ||||||
| Expt B |
7 peptides |
25 spectra |
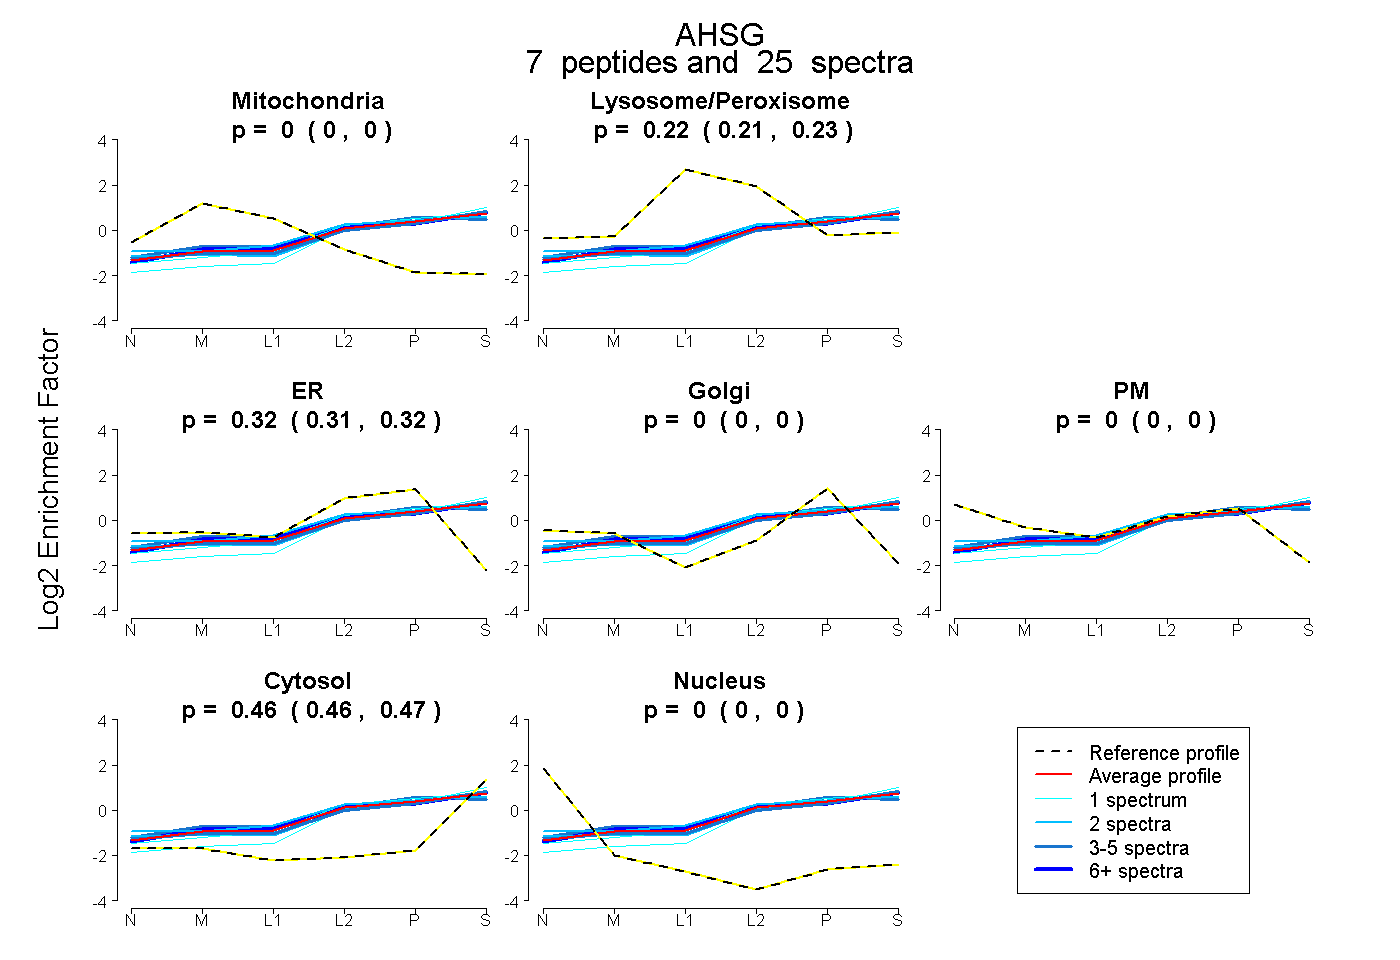 |
0.000 0.000 | 0.000 |
0.220 0.214 | 0.225 |
0.316 0.311 | 0.322 |
0.000 0.000 | 0.000 |
0.000 0.000 | 0.000 |
0.463 0.460 | 0.466 |
0.000 0.000 | 0.000 |
|||
| Plot | Lyso | Other | |||||||||||
| Expt C |
10 peptides |
136 spectra |
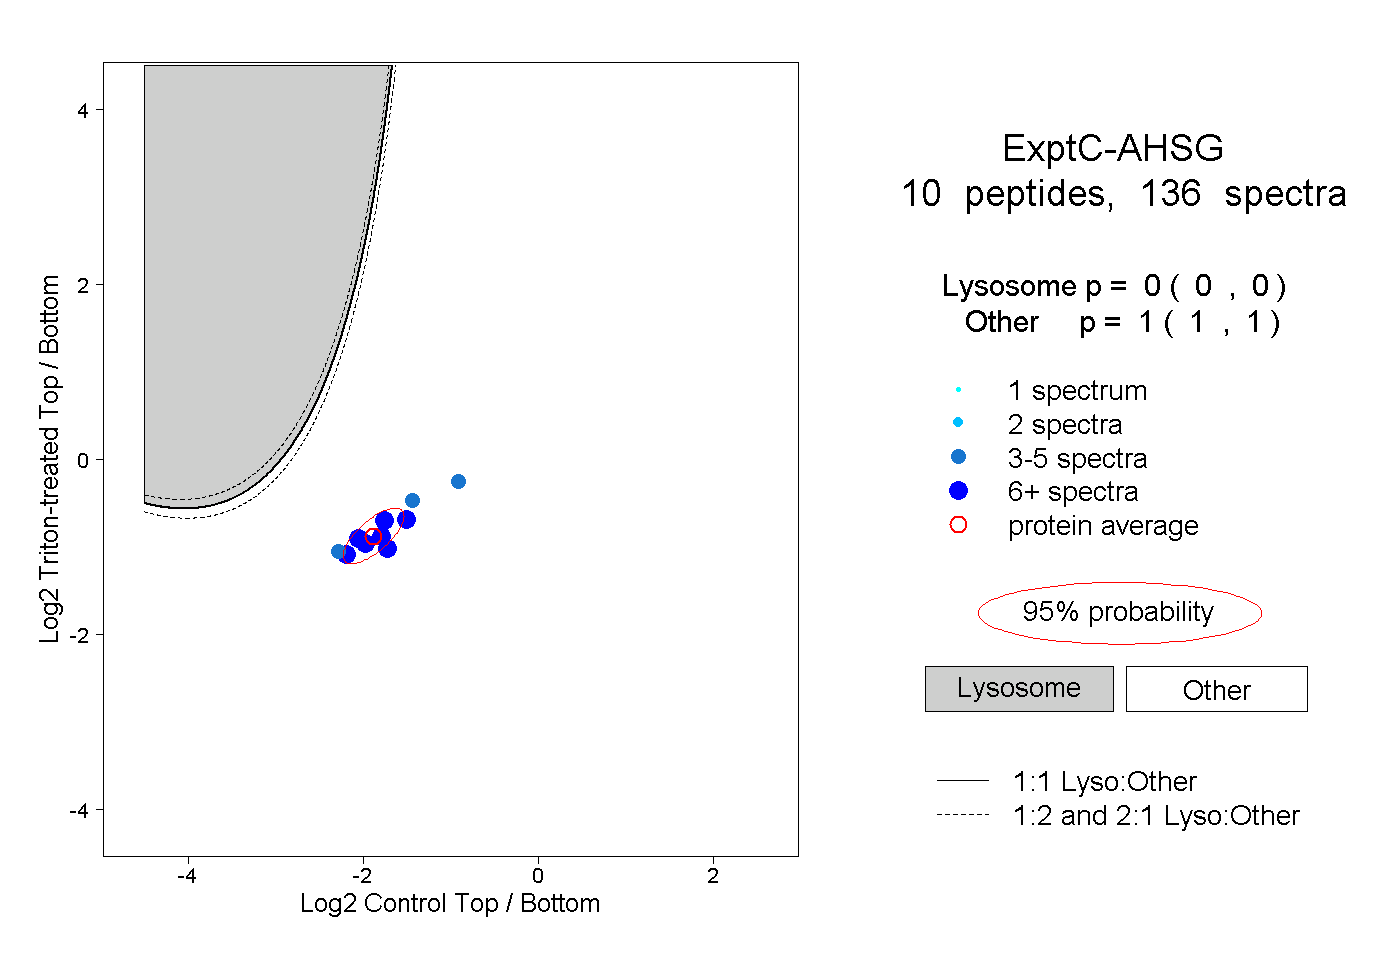 |
0.000 0.000 | 0.000 |
1.000 1.000 | 1.000 |
||||||||
| Plot | Lyso | Other | |||||||||||
| Expt D |
7 peptides |
38 spectra |
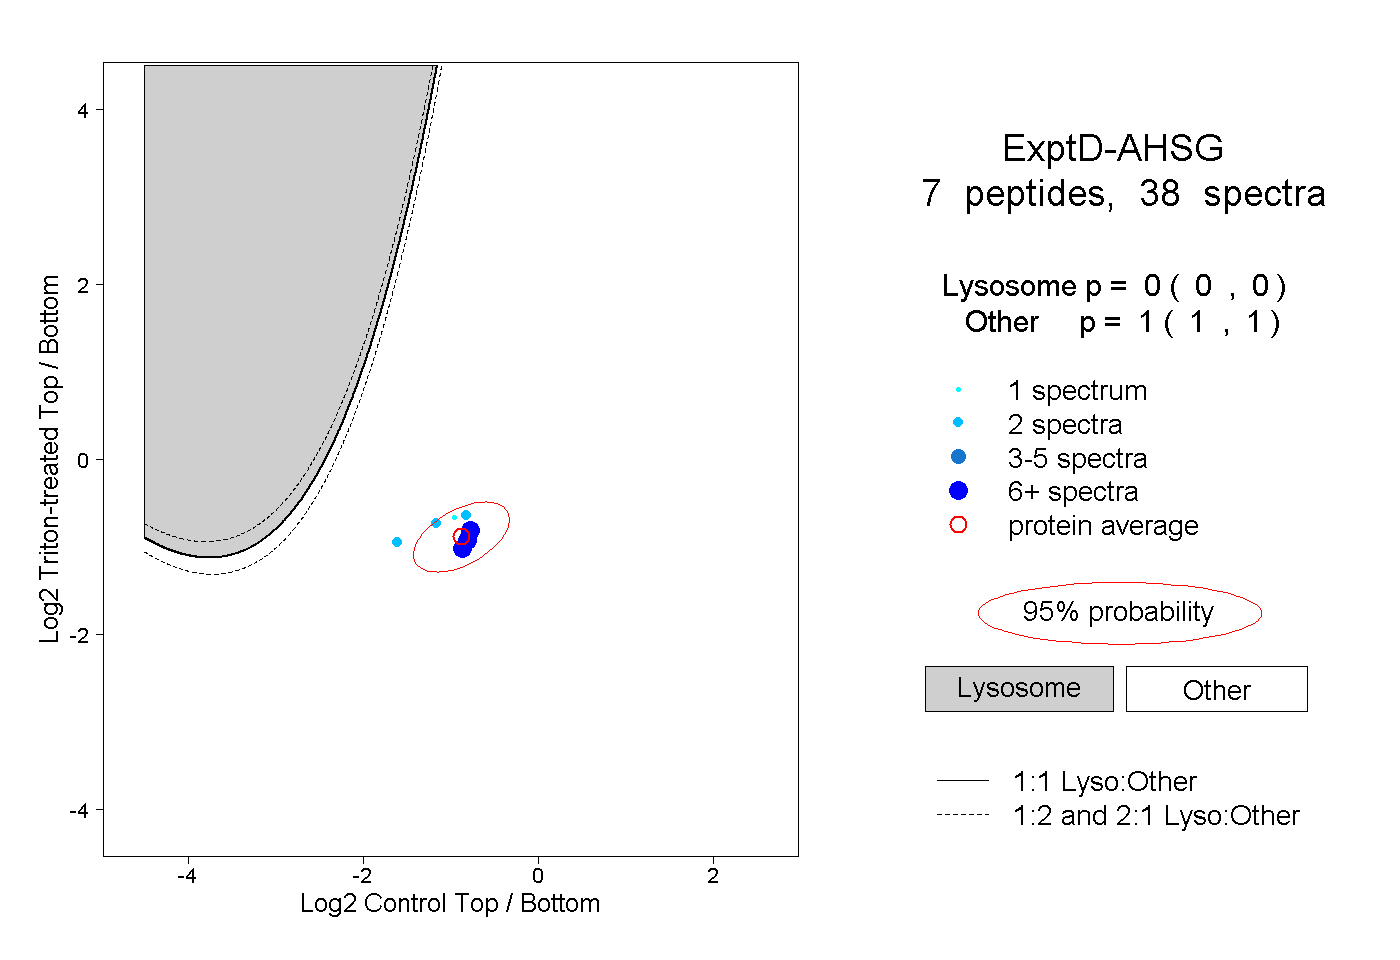 |
0.000 0.000 | 0.000 |
1.000 1.000 | 1.000 |