 12
12peptides
spectra
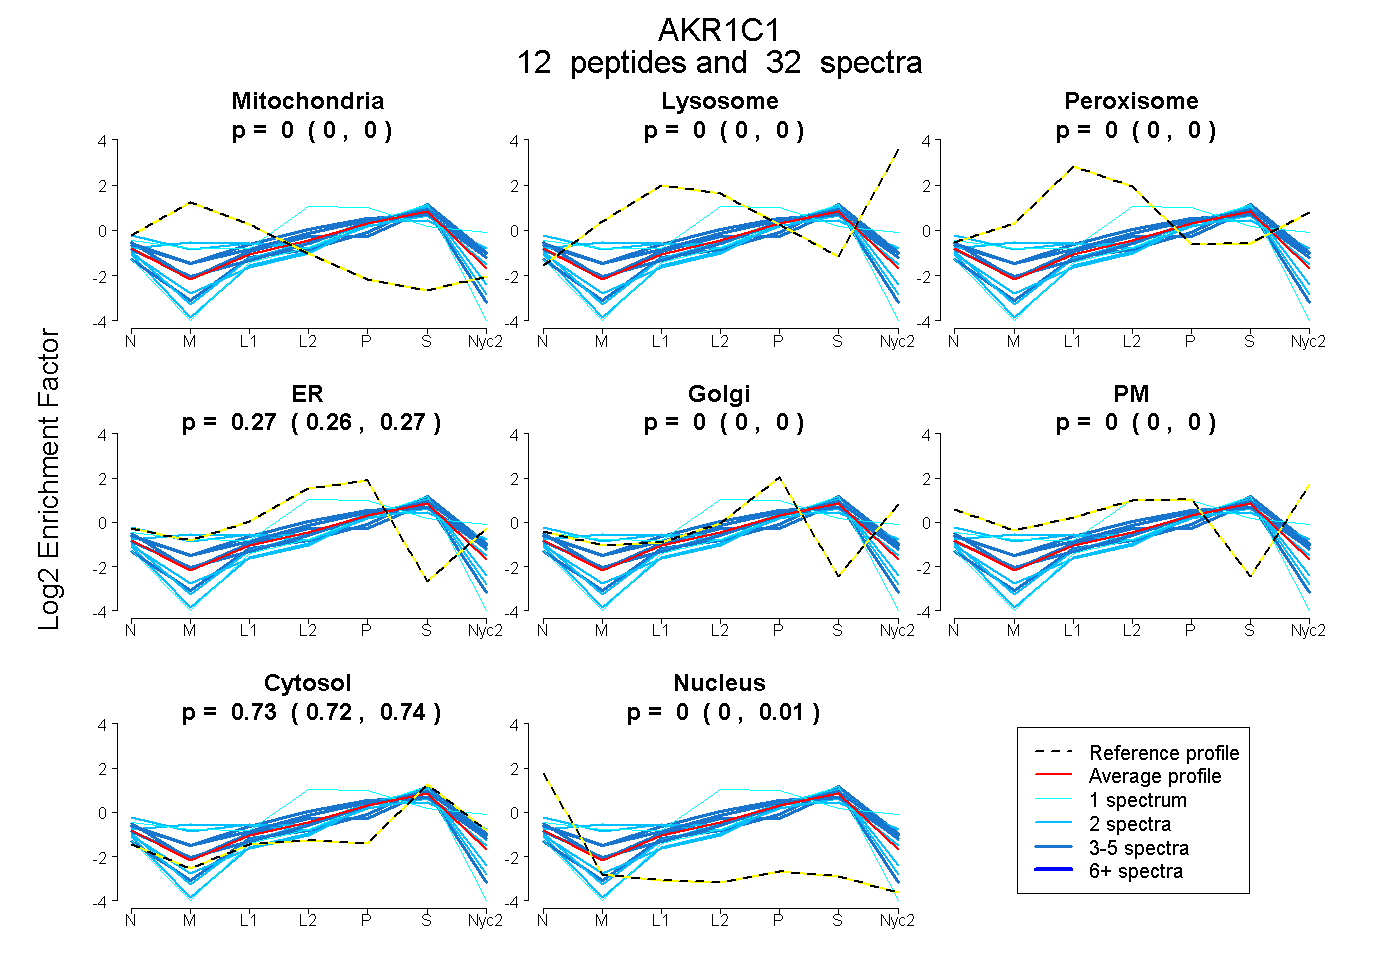
0.000 | 0.000
0.000 | 0.000
0.000 | 0.000
0.259 | 0.274
0.000 | 0.000
0.000 | 0.000
0.722 | 0.735
0.000 | 0.010
5peptides
spectra
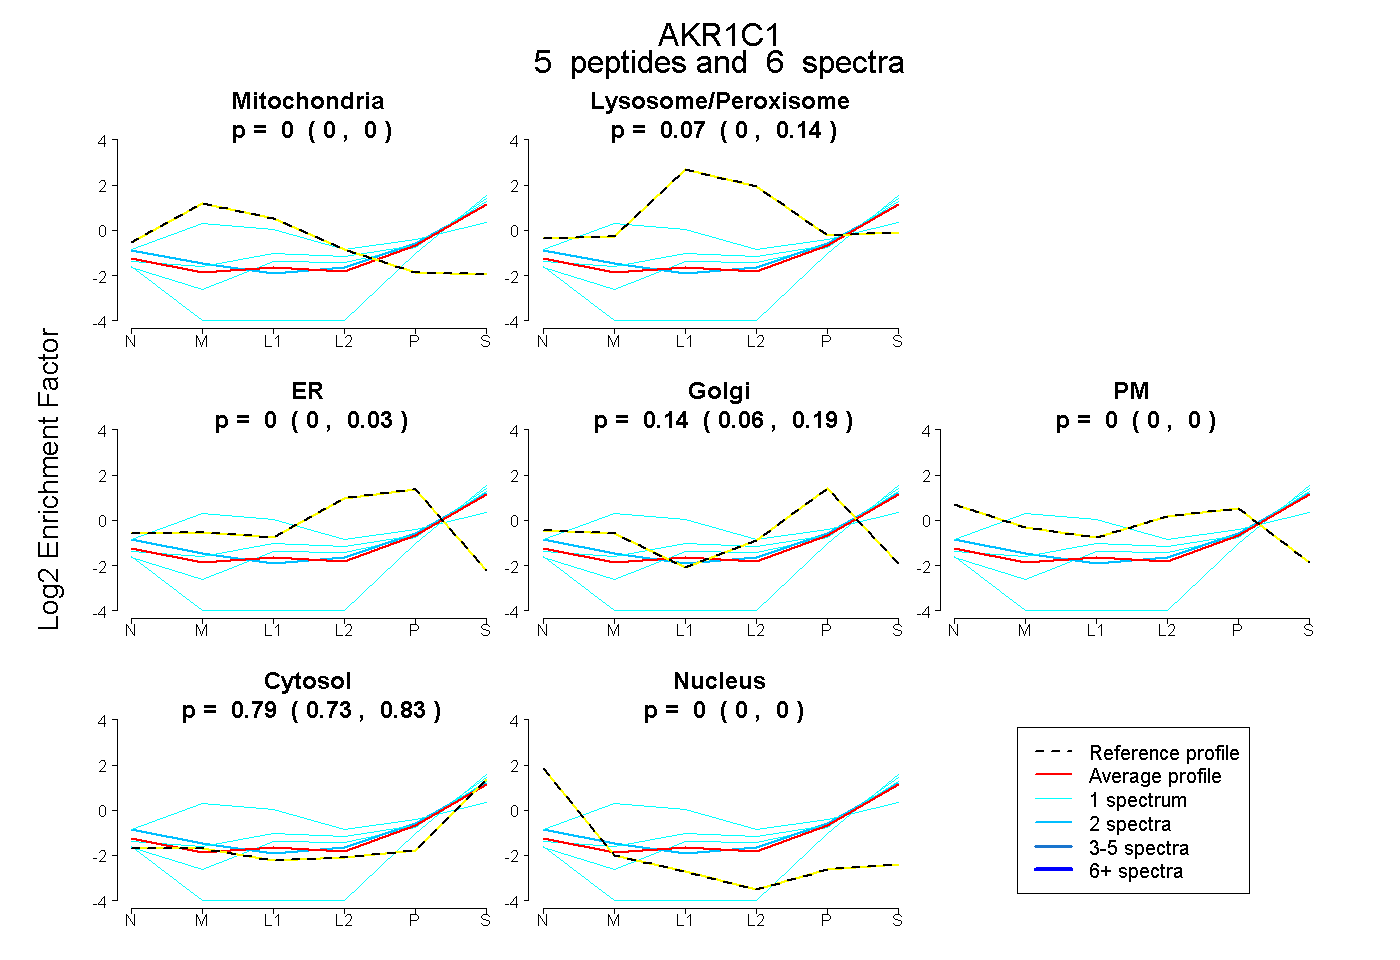
0.000 | 0.000
0.000 | 0.139
0.000 | 0.031
0.062 | 0.191
0.000 | 0.000
0.731 | 0.827
0.000 | 0.000
10peptides
spectra
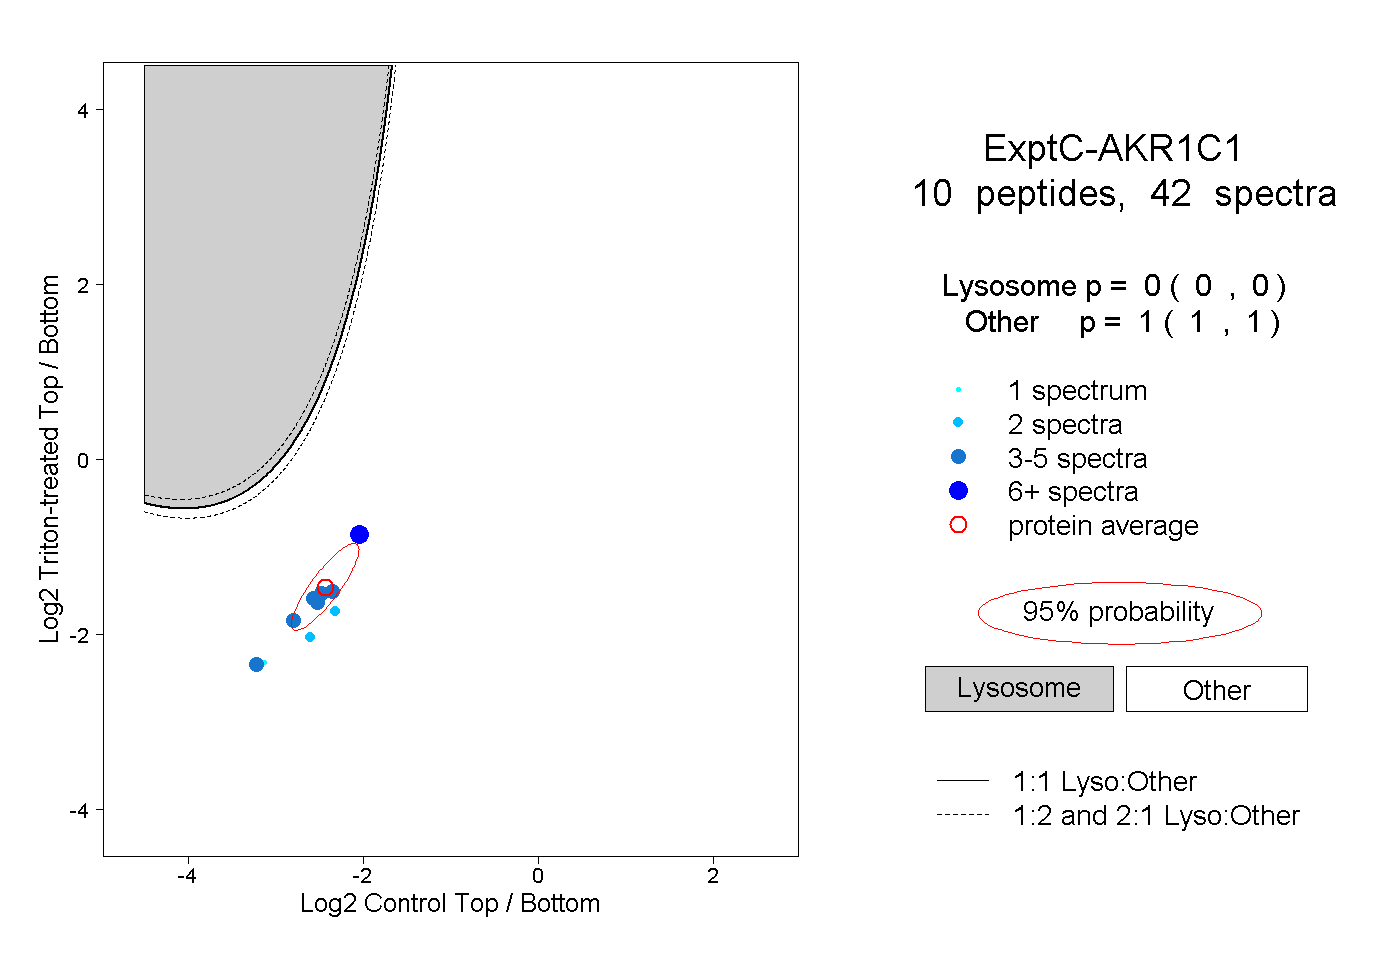
0.000 | 0.000
1.000 | 1.000
3peptides
spectra
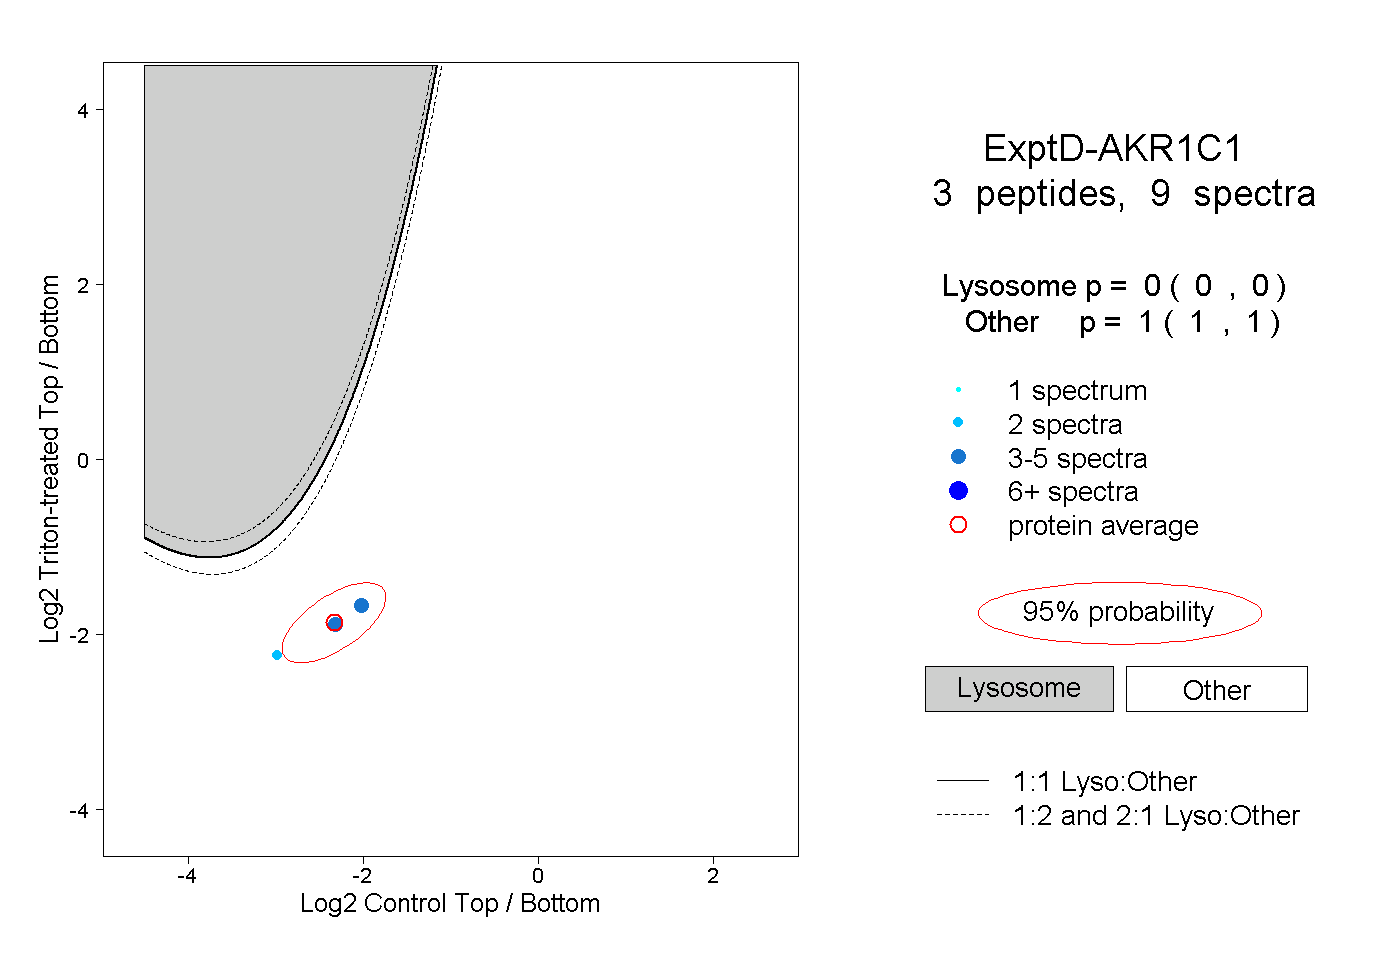
0.000 | 0.000
1.000 | 1.000