 3
3peptides
spectra
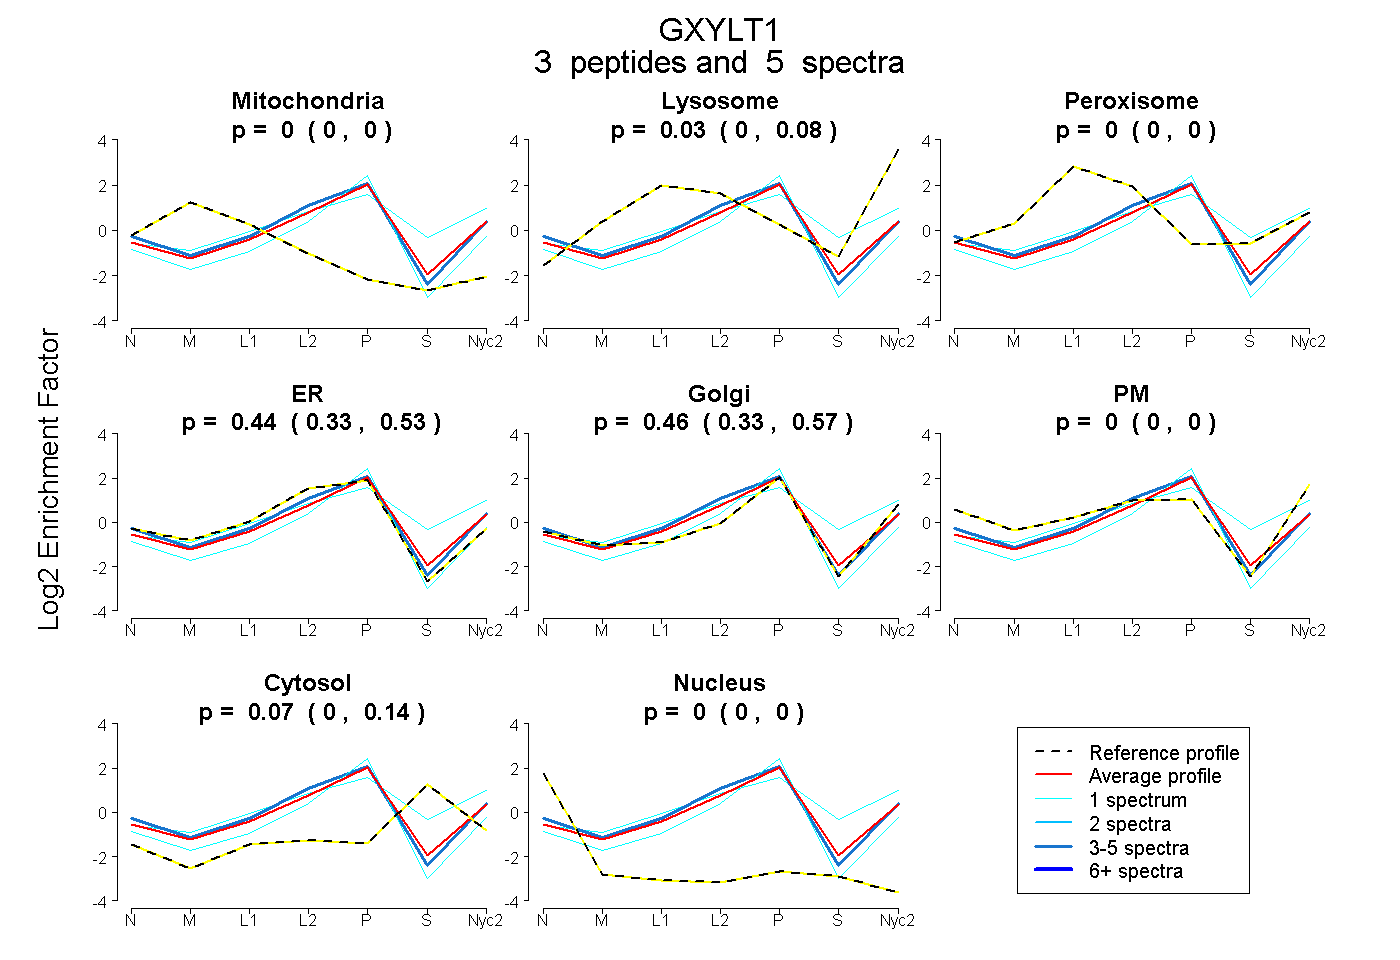
0.000 | 0.000
0.000 | 0.078
0.000 | 0.000
0.327 | 0.534
0.325 | 0.572
0.000 | 0.000
0.000 | 0.137
0.000 | 0.000
| Plot | Mito | Lyso | Perox | ER | Golgi | PM | Cytosol | Nucleus | |||||
| Expt A |
3 peptides |
5 spectra |
|
0.000 0.000 | 0.000 |
0.028 0.000 | 0.078 |
0.000 0.000 | 0.000 |
0.442 0.327 | 0.534 |
0.461 0.325 | 0.572 |
0.000 0.000 | 0.000 |
0.069 0.000 | 0.137 |
0.000 0.000 | 0.000 |
| 1 spectrum, LFLPLILK | 0.000 | 0.000 | 0.000 | 0.363 | 0.594 | 0.000 | 0.000 | 0.043 | ||
| 3 spectra, LFKPCASQR | 0.000 | 0.019 | 0.000 | 0.574 | 0.385 | 0.023 | 0.000 | 0.000 | ||
| 1 spectrum, LDSWSFLQR | 0.000 | 0.271 | 0.000 | 0.271 | 0.231 | 0.000 | 0.227 | 0.000 |
| Plot | Lyso | Other | |||||||||||
| Expt C |
5 peptides |
6 spectra |
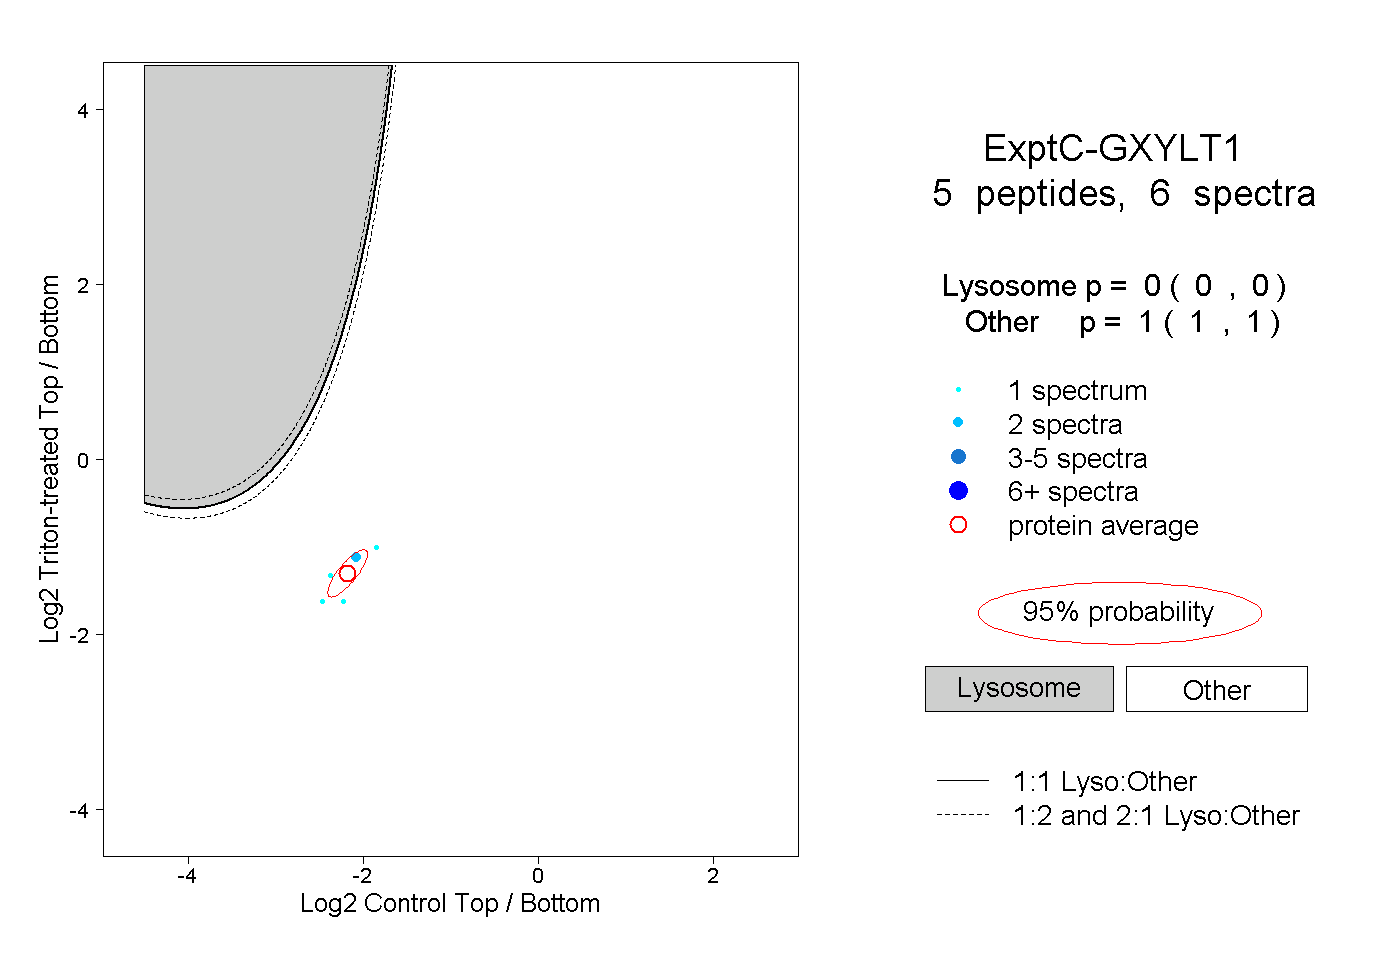 |
0.000 0.000 | 0.000 |
1.000 1.000 | 1.000 |