 1
1peptide
spectra
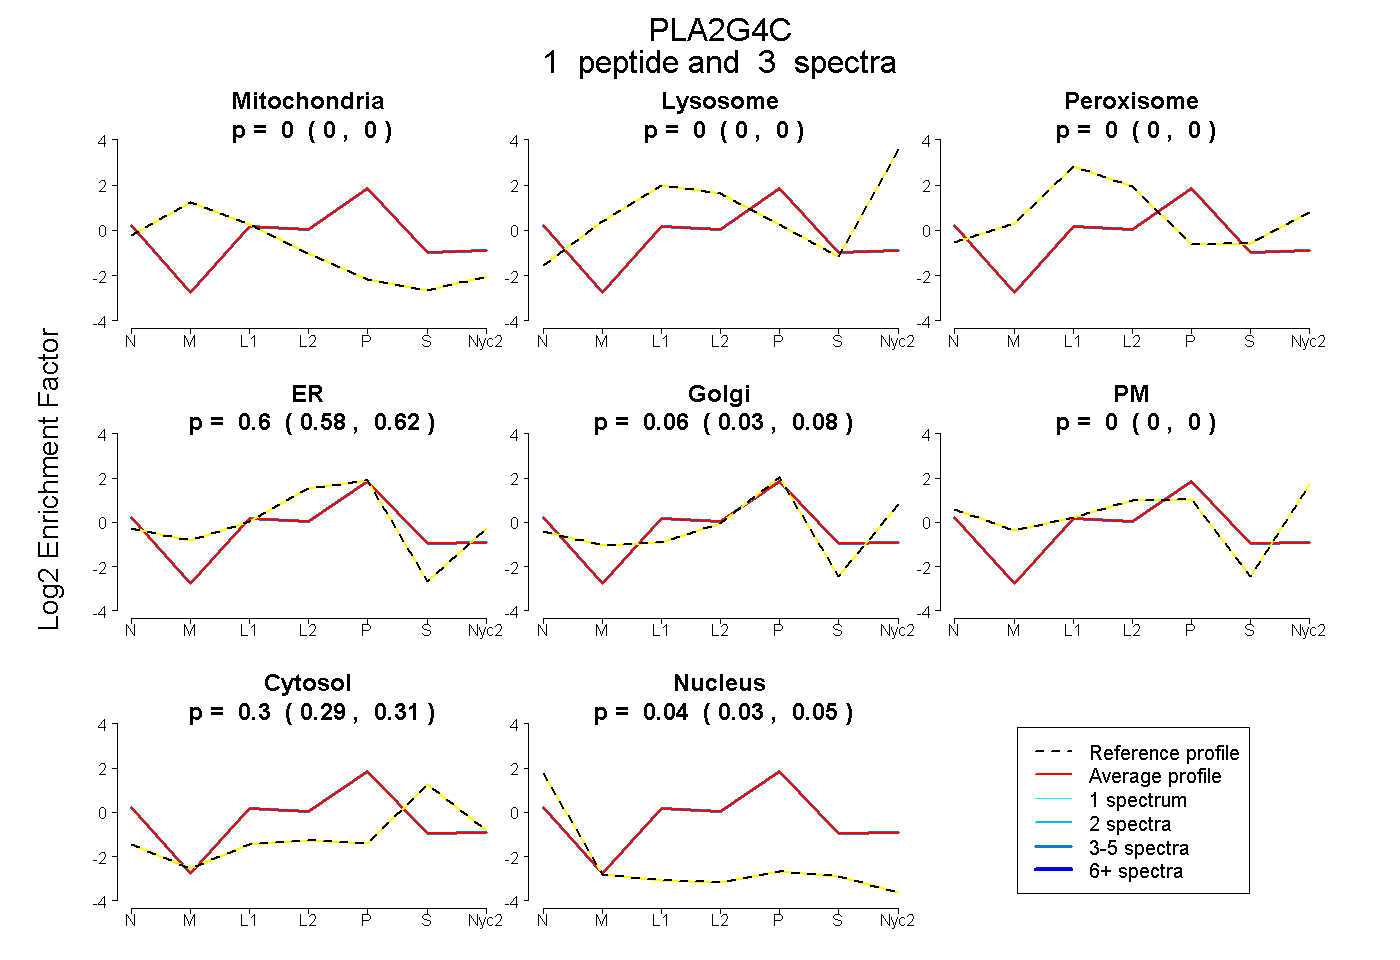
0.000 | 0.000
0.000 | 0.000
0.000 | 0.000
0.578 | 0.621
0.032 | 0.080
0.000 | 0.000
0.288 | 0.312
0.031 | 0.046
1peptide
spectrum
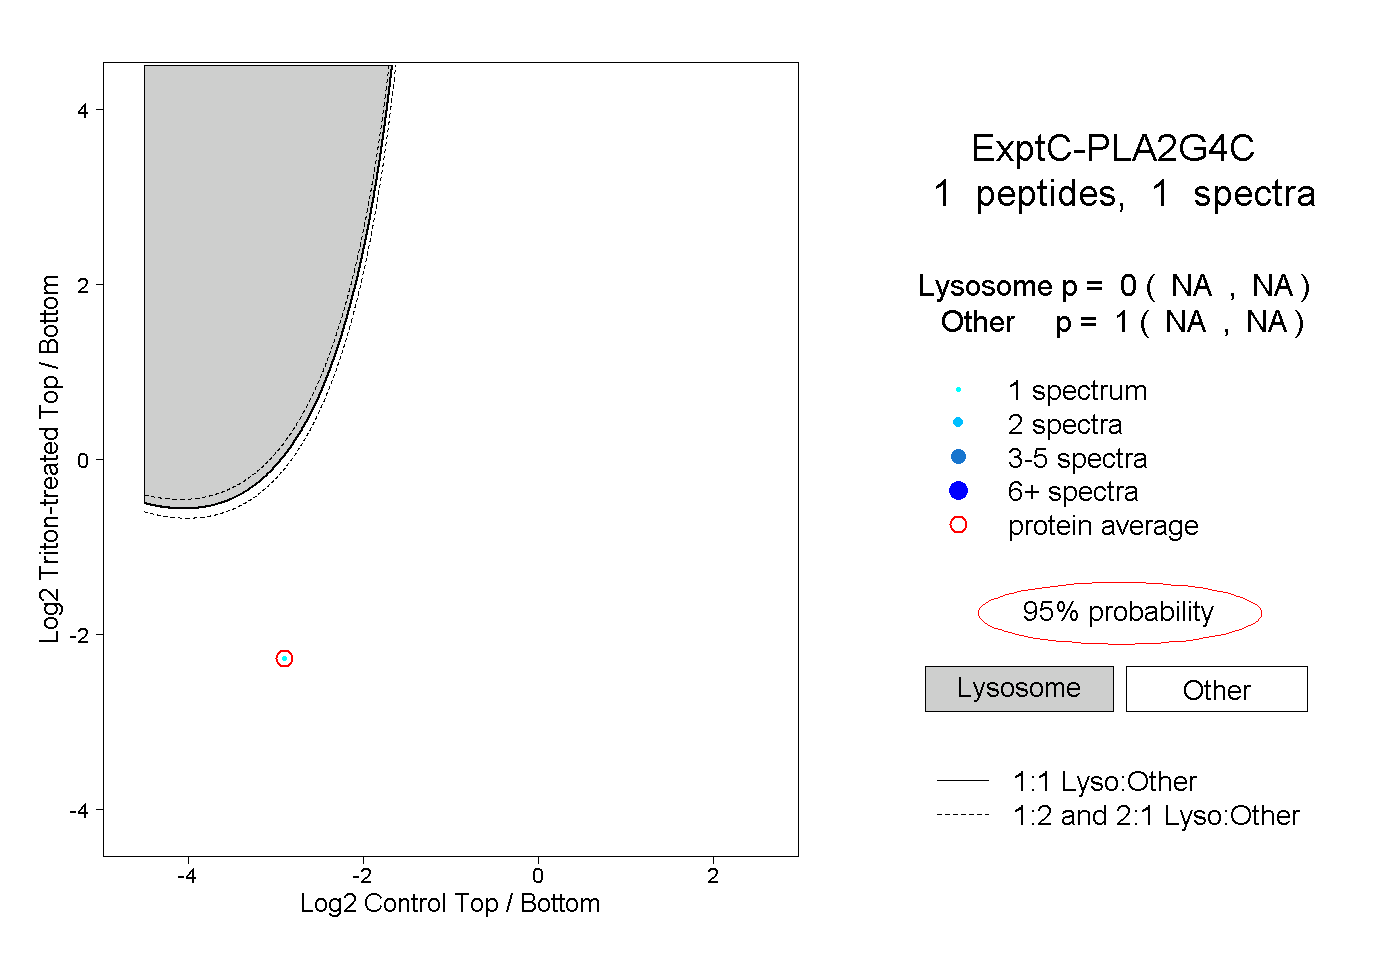
NA | NA
NA | NA
| Plot | Mito | Lyso | Perox | ER | Golgi | PM | Cytosol | Nucleus | |||||
| Expt A |
1 peptide |
3 spectra |
|
0.000 0.000 | 0.000 |
0.000 0.000 | 0.000 |
0.000 0.000 | 0.000 |
0.602 0.578 | 0.621 |
0.058 0.032 | 0.080 |
0.000 0.000 | 0.000 |
0.301 0.288 | 0.312 |
0.039 0.031 | 0.046 |
||
| Plot | Lyso | Other | |||||||||||
| Expt C |
1 peptide |
1 spectrum |
|
0.000 NA | NA |
1.000 NA | NA |