 1
1peptide
spectra
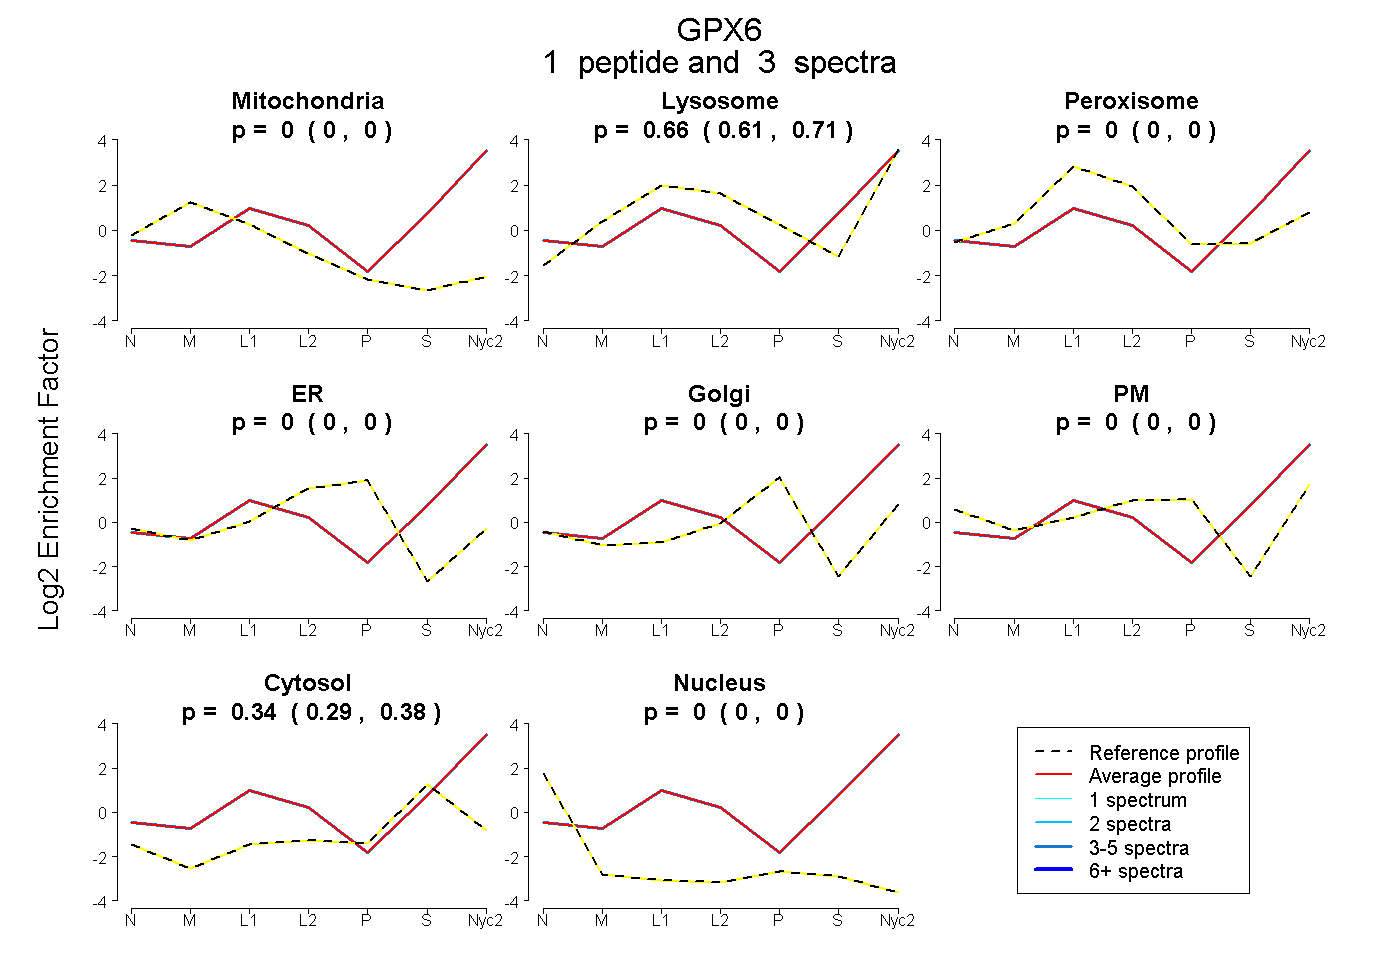
0.000 | 0.000
0.609 | 0.708
0.000 | 0.000
0.000 | 0.000
0.000 | 0.000
0.000 | 0.000
0.286 | 0.378
0.000 | 0.000
1peptide
spectrum
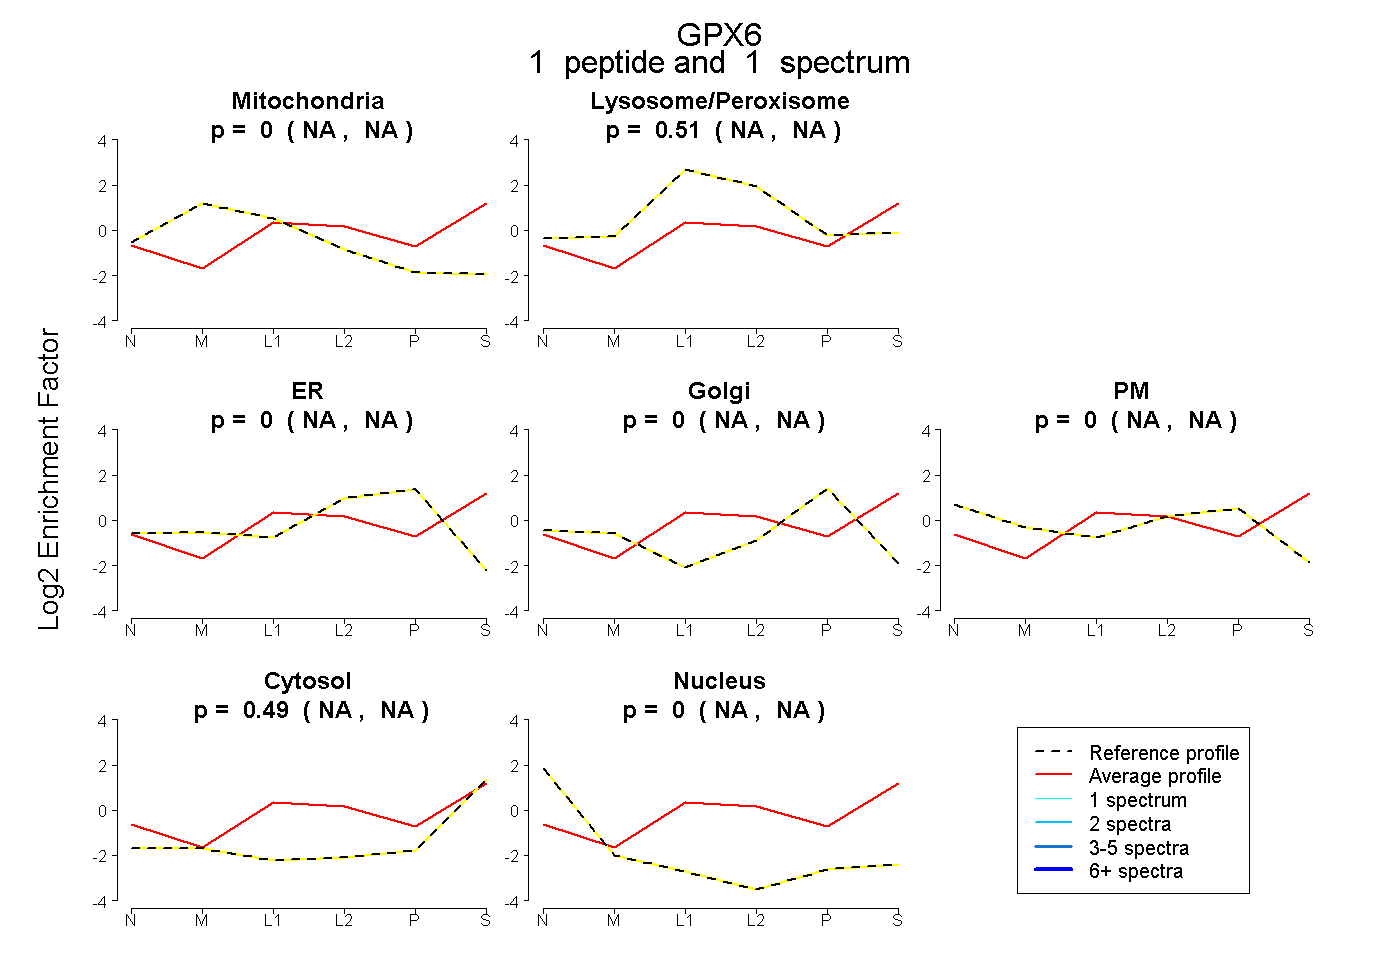
NA | NA
NA | NA
NA | NA
NA | NA
NA | NA
NA | NA
NA | NA
1peptide
spectra
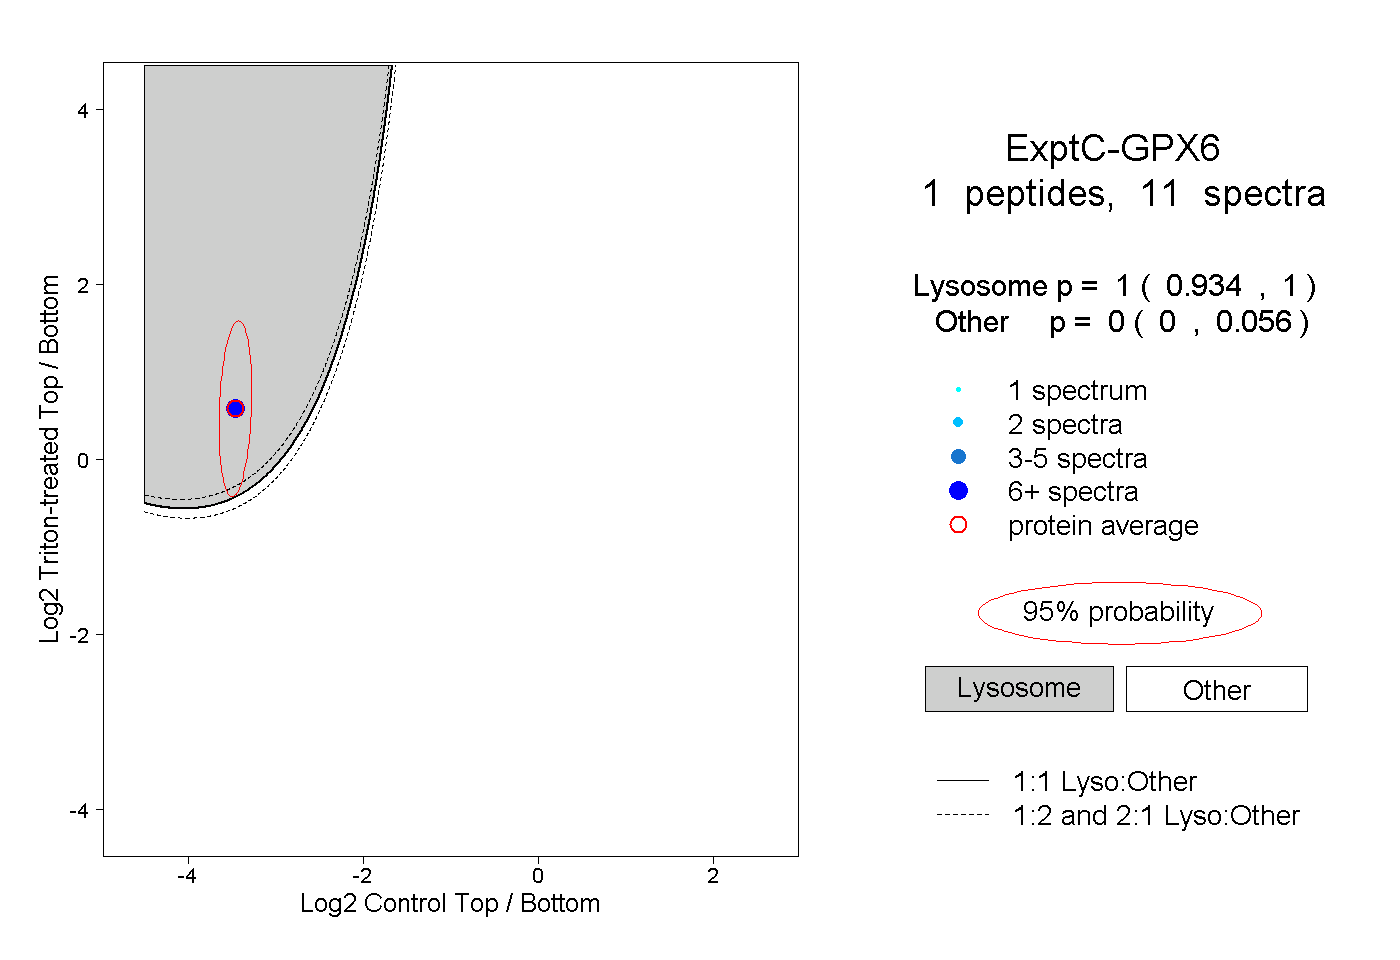
0.934 | 1.000
0.000 | 0.056