 4
4peptides
spectra
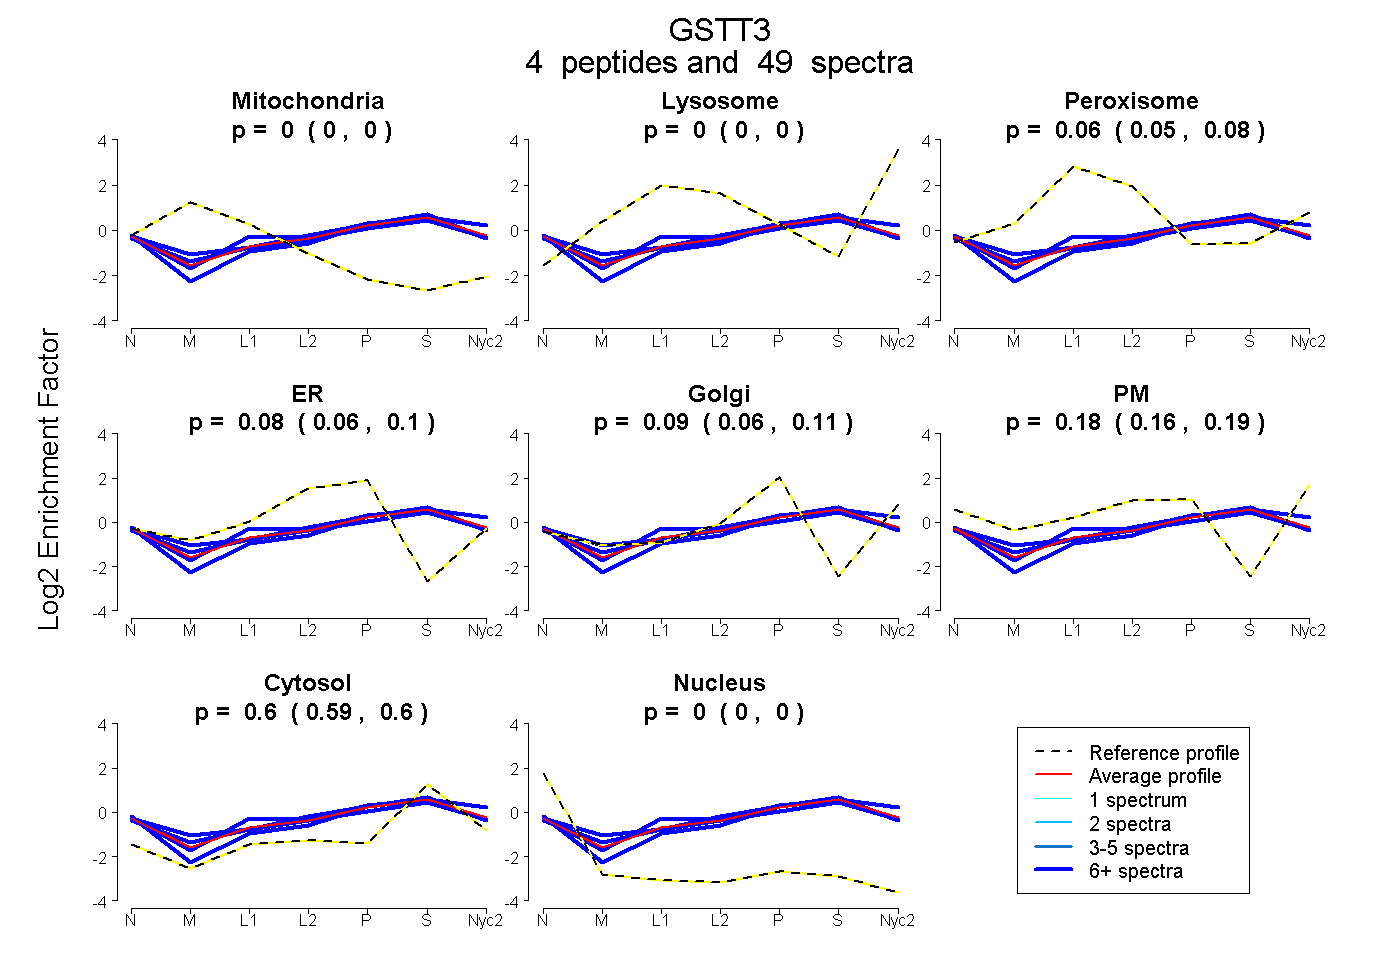
0.000 | 0.000
0.000 | 0.000
0.046 | 0.075
0.057 | 0.097
0.062 | 0.109
0.158 | 0.192
0.586 | 0.604
0.000 | 0.000
4peptides
spectra
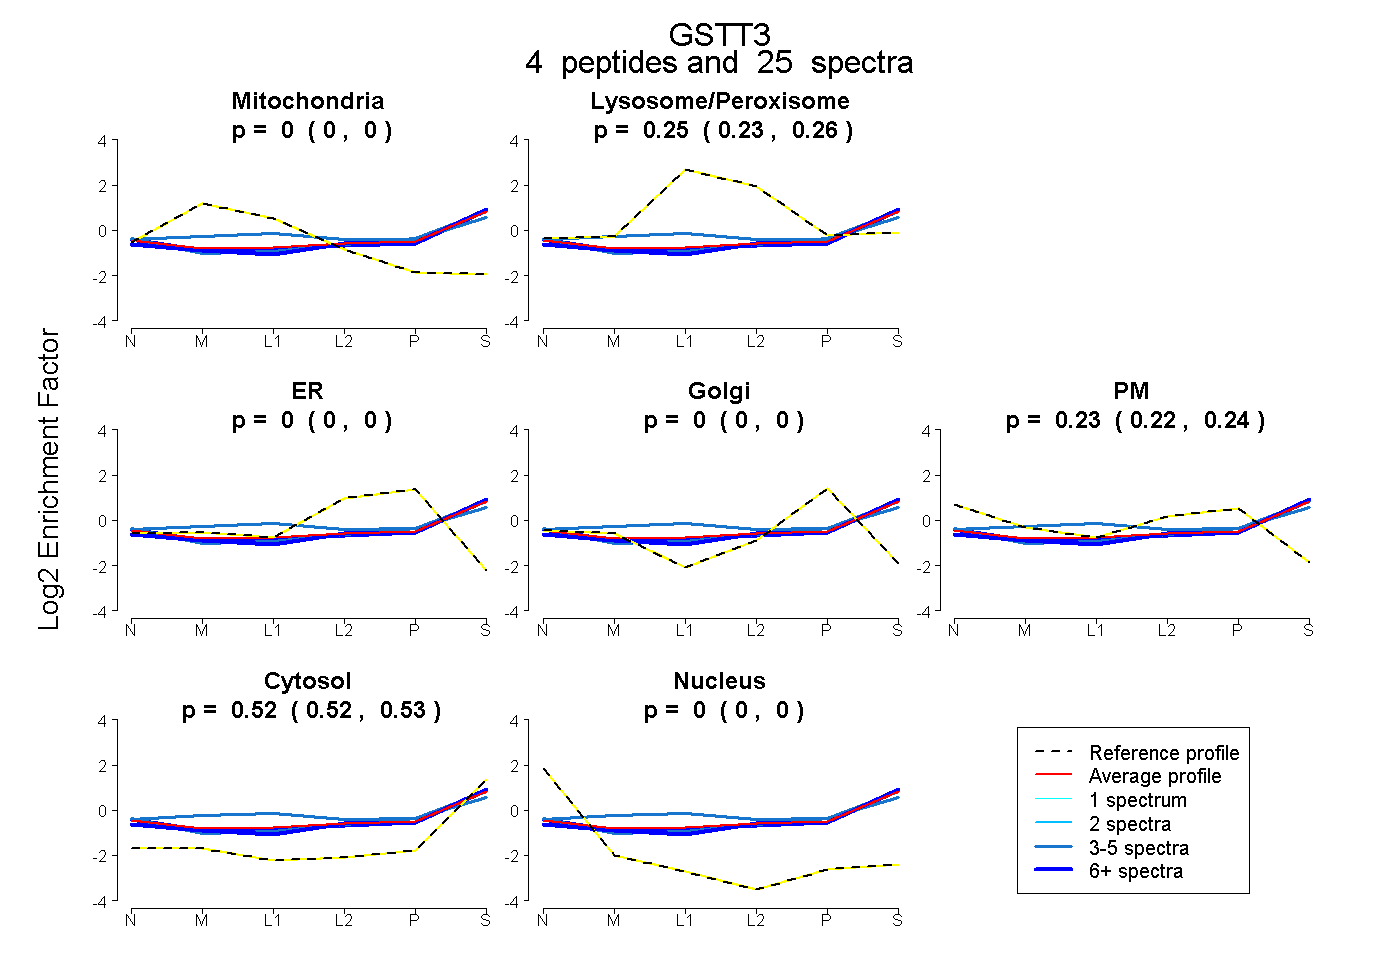
0.000 | 0.000
0.233 | 0.255
0.000 | 0.000
0.000 | 0.002
0.221 | 0.240
0.516 | 0.527
0.000 | 0.000
4peptides
spectra
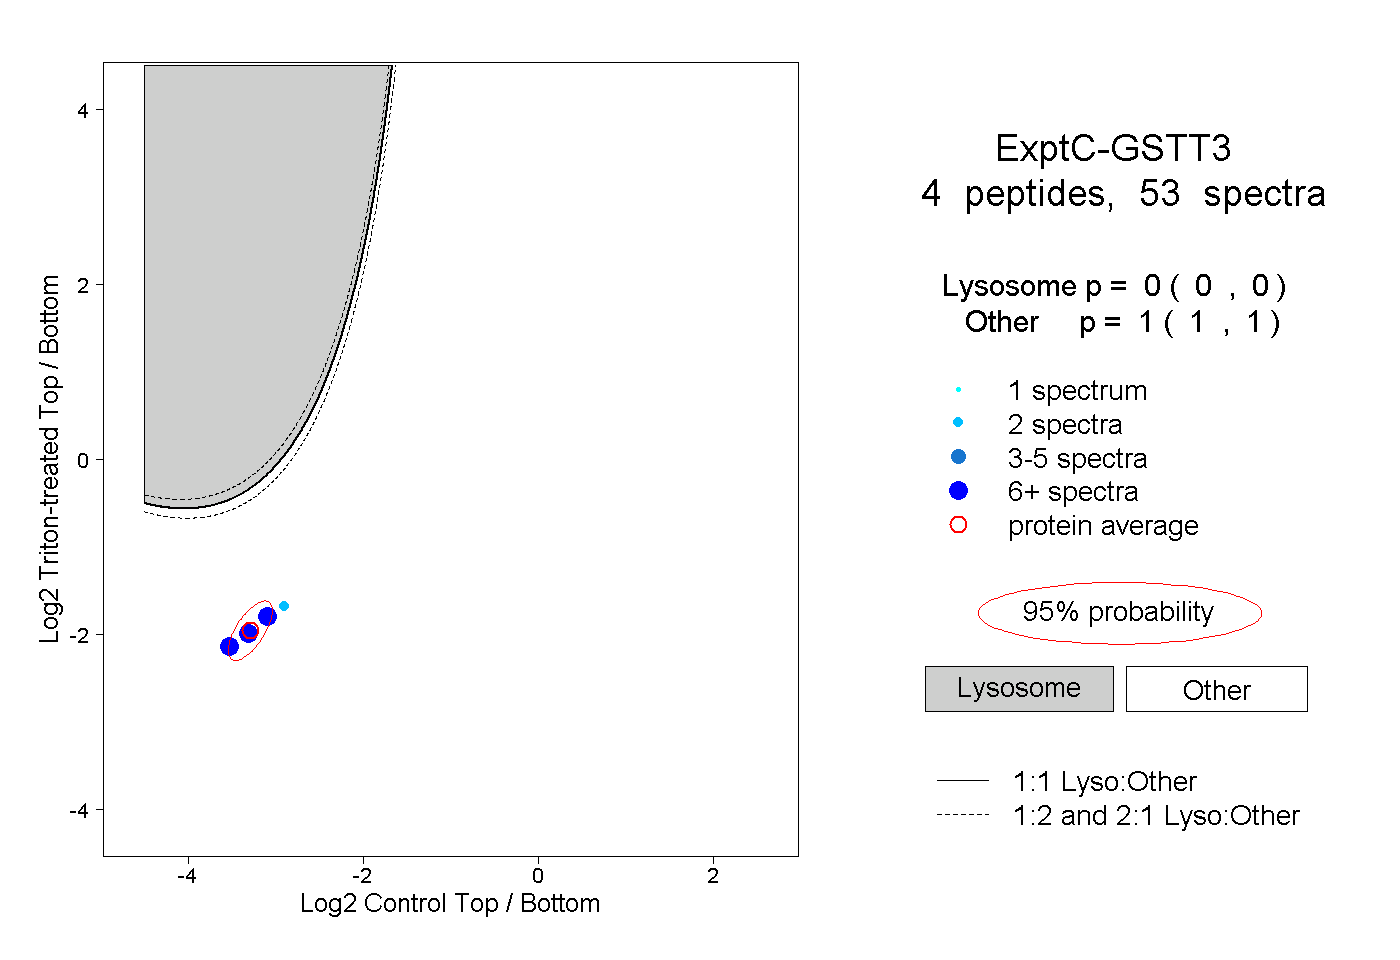
0.000 | 0.000
1.000 | 1.000
2peptides
spectra
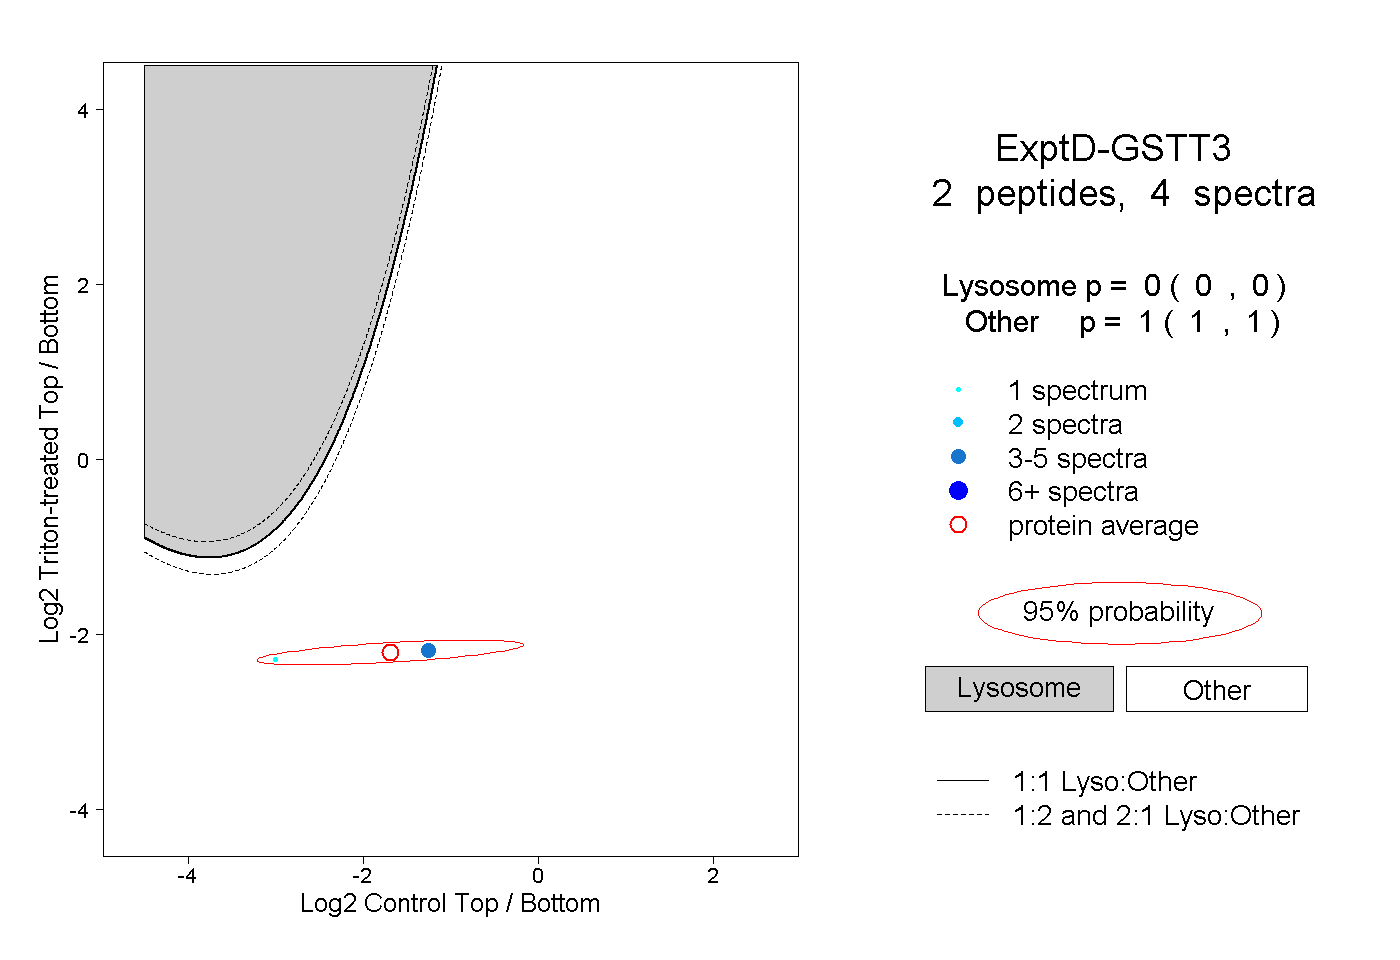
0.000 | 0.000
1.000 | 1.000