 19
19peptides
spectra
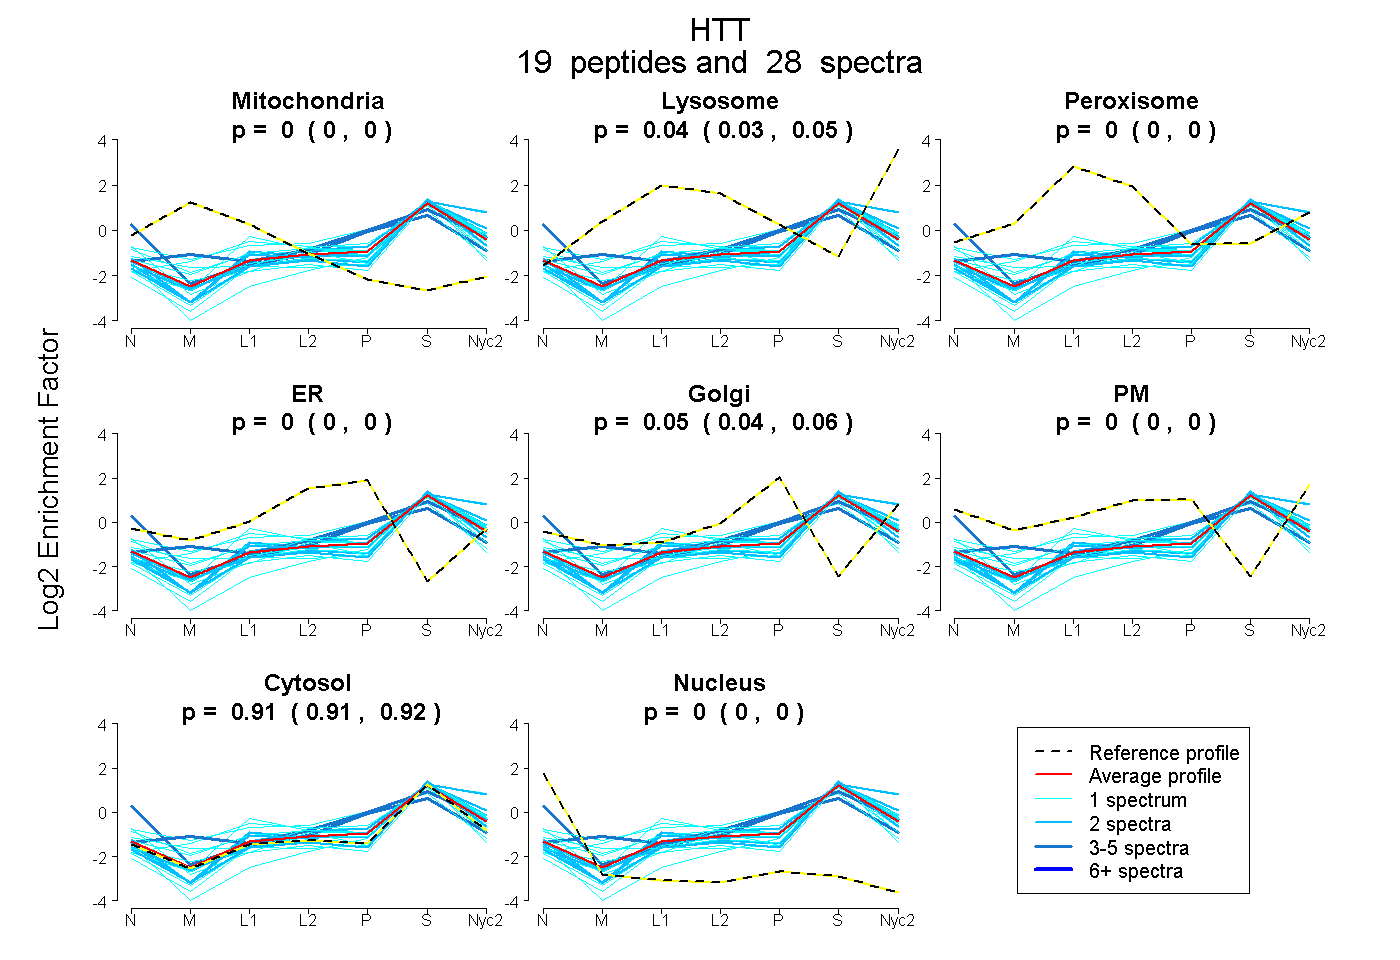
0.000 | 0.000
0.031 | 0.047
0.000 | 0.000
0.000 | 0.000
0.039 | 0.055
0.000 | 0.000
0.906 | 0.918
0.000 | 0.000
1peptide
spectrum
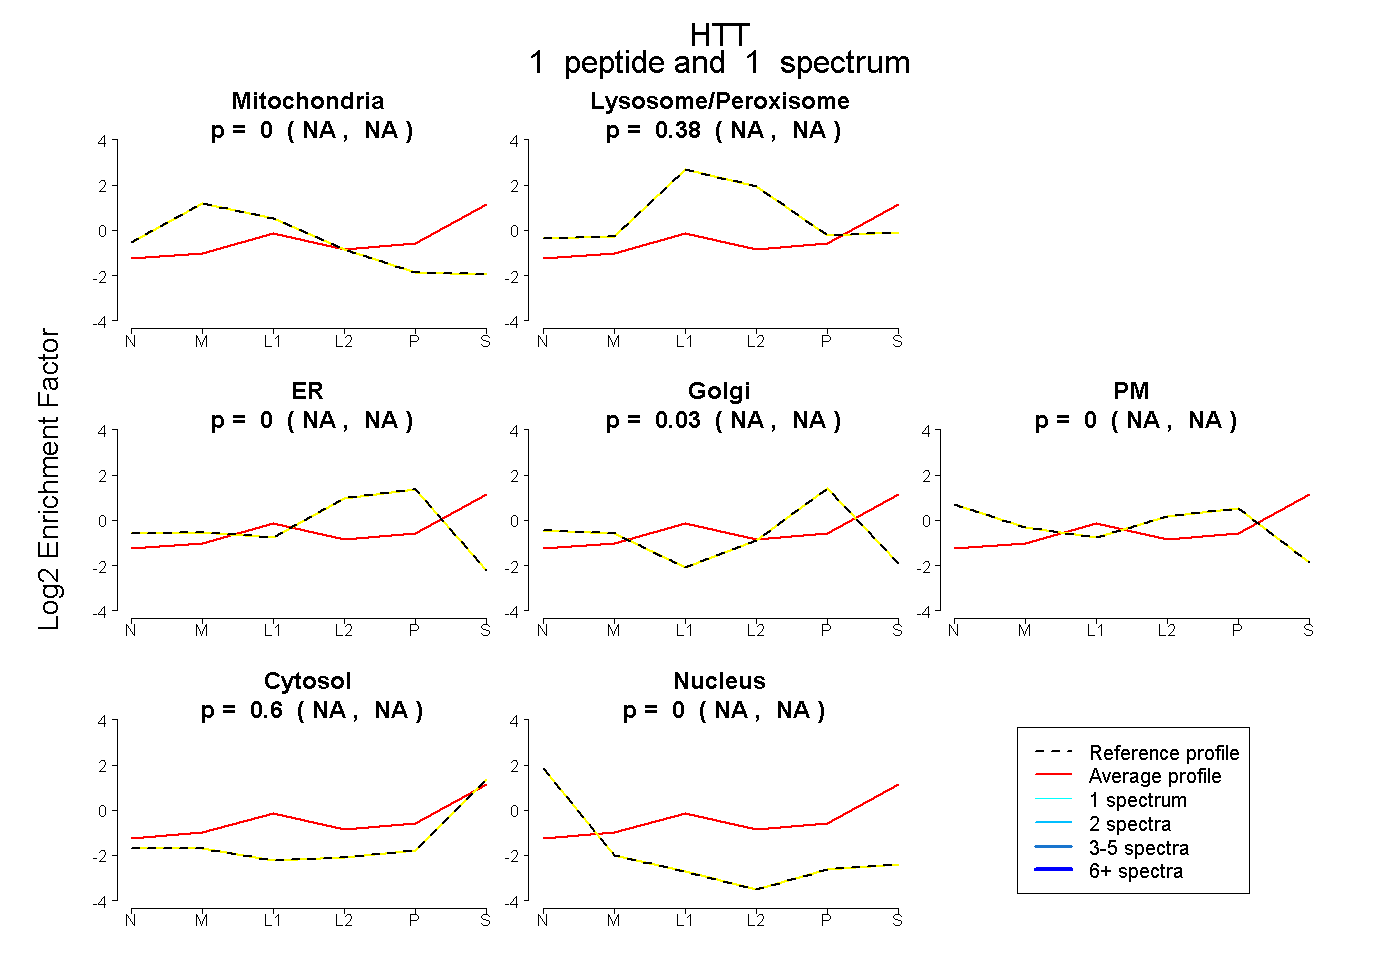
NA | NA
NA | NA
NA | NA
NA | NA
NA | NA
NA | NA
NA | NA
6peptides
spectra
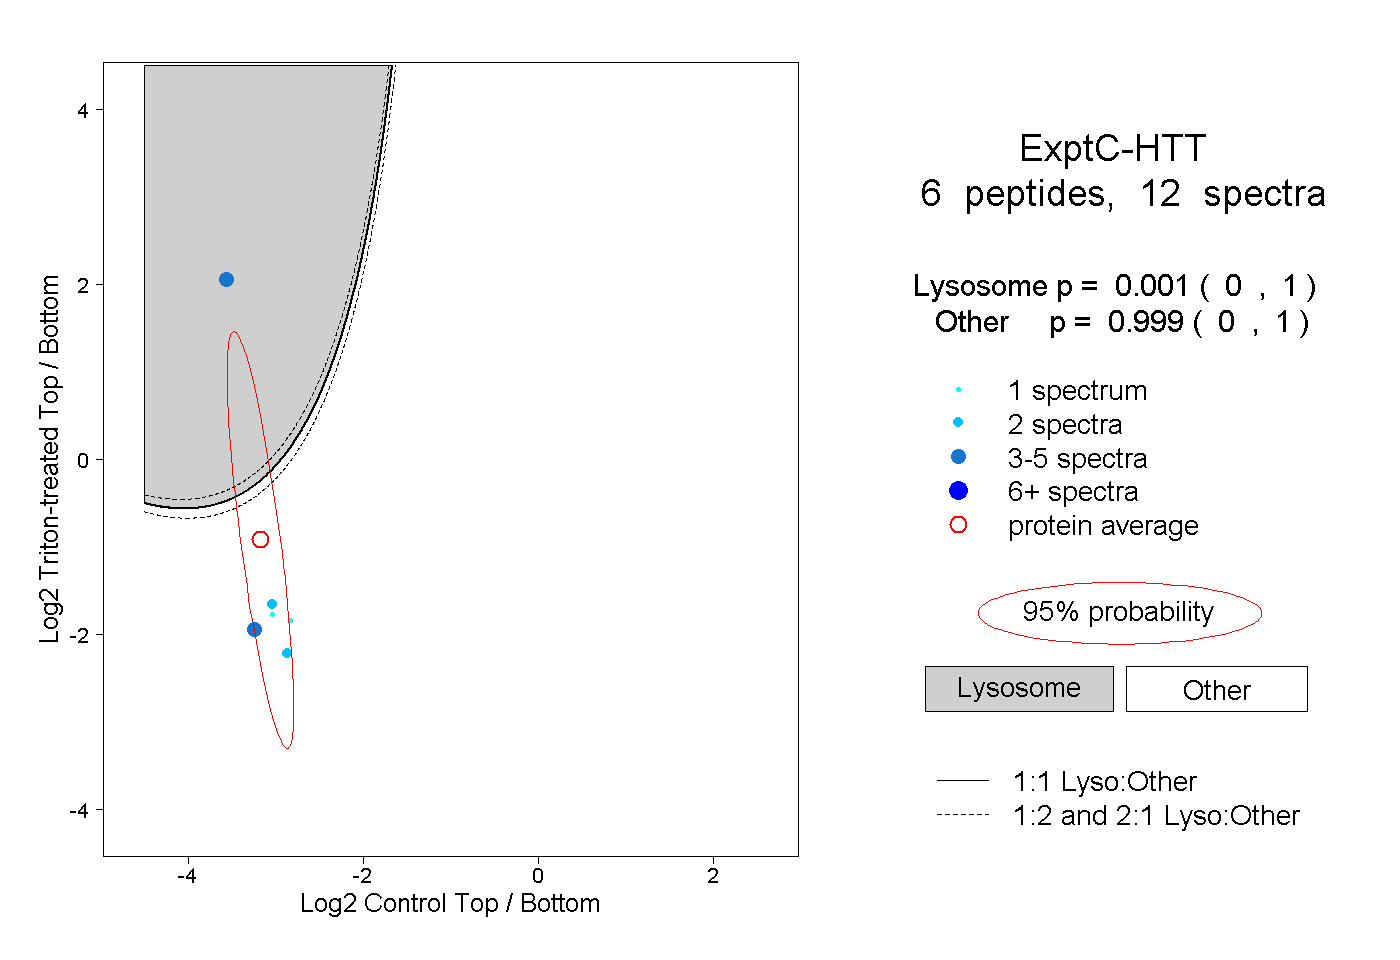
0.000 | 1.000
0.000 | 1.000