ATP7B
[ENSRNOP00000054880]
Main page
| | | Plot |
Mito |
Lyso |
|
Perox |
ER |
Golgi |
PM |
Cytosol |
Nucleus |
|
| Expt A |
 21
21
peptides |
34
spectra |
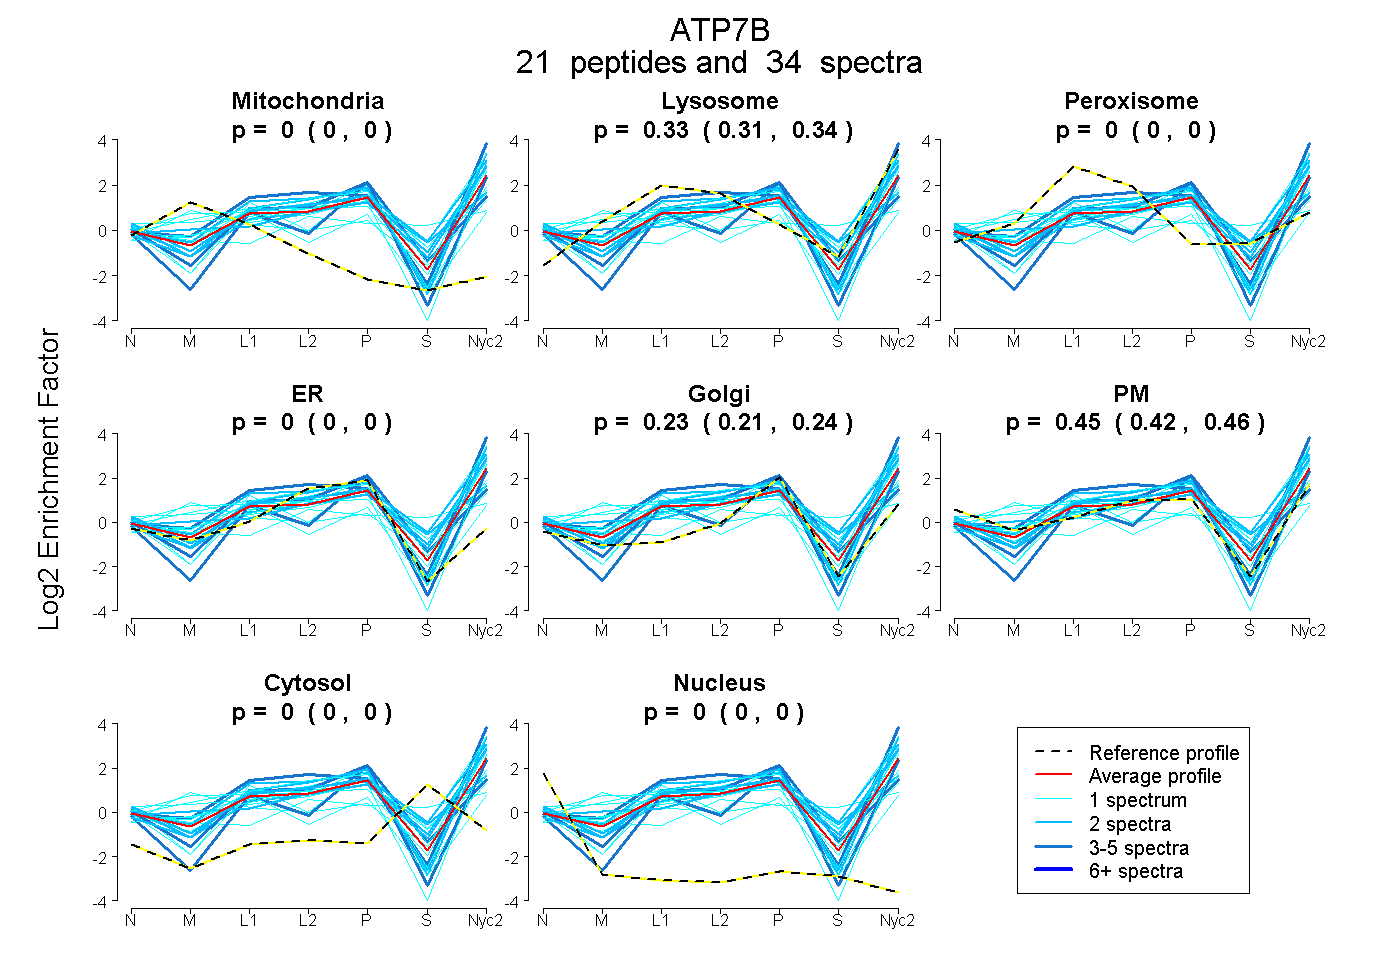 |
0.000
0.000 | 0.000 |
0.326
0.314 | 0.336 |
|
0.000
0.000 | 0.000 |
0.000
0.000 | 0.000 |
0.229
0.212 | 0.243 |
0.445
0.424 | 0.463 |
0.000
0.000 | 0.000 |
0.000
0.000 | 0.000 |
|
| | | Plot |
Mito |
|
Lyso or Perox |
|
ER |
Golgi |
PM |
Cytosol |
Nucleus |
|
| Expt B |
5
peptides |
8
spectra |
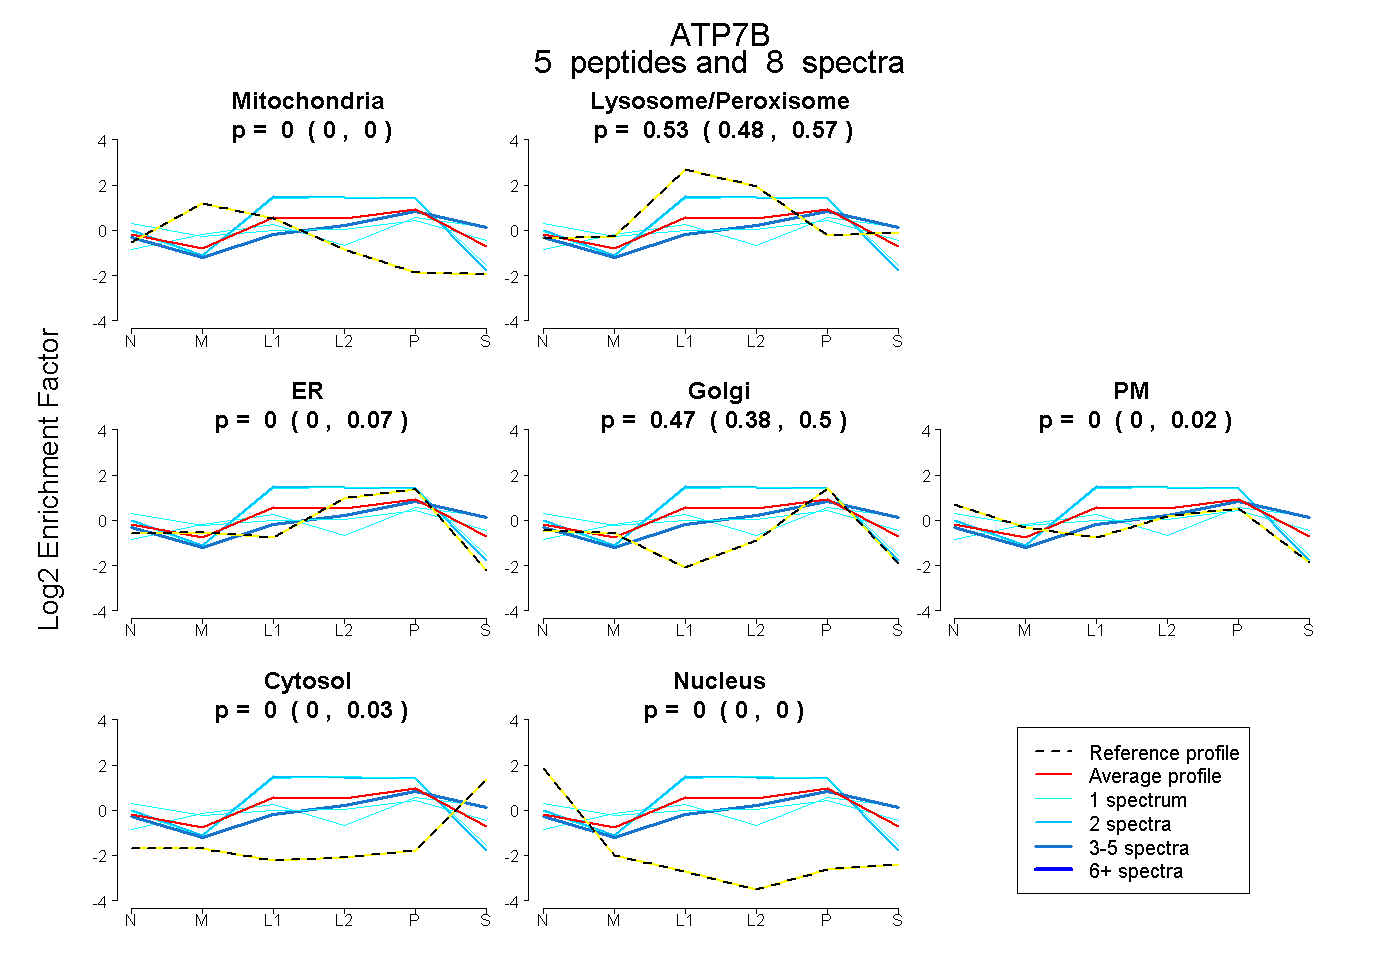 |
0.000
0.000 | 0.000 |
|
0.531
0.479 | 0.565 |
|
0.000
0.000 | 0.071 |
0.469
0.378 | 0.497 |
0.000
0.000 | 0.021 |
0.000
0.000 | 0.030 |
0.000
0.000 | 0.003 |
|
| 3 spectra, TAVLTITGIPR |
0.000 |
|
0.417 |
|
0.000 |
0.398 |
0.000 |
0.185 |
0.000 |
|
| 2 spectra, APIQQLADR |
0.000 |
|
0.453 |
|
0.547 |
0.000 |
0.000 |
0.000 |
0.000 |
|
| 1 spectrum, FDPEIIGPR |
0.000 |
|
0.461 |
|
0.539 |
0.000 |
0.000 |
0.000 |
0.000 |
|
| 1 spectrum, AIATQVGINK |
0.000 |
|
0.415 |
|
0.000 |
0.338 |
0.000 |
0.247 |
0.000 |
|
| 1 spectrum, YDPEVIQSPR |
0.000 |
|
0.301 |
|
0.000 |
0.107 |
0.461 |
0.132 |
0.000 |
|
| | | Plot |
|
Lyso |
|
|
|
|
|
|
|
Other |
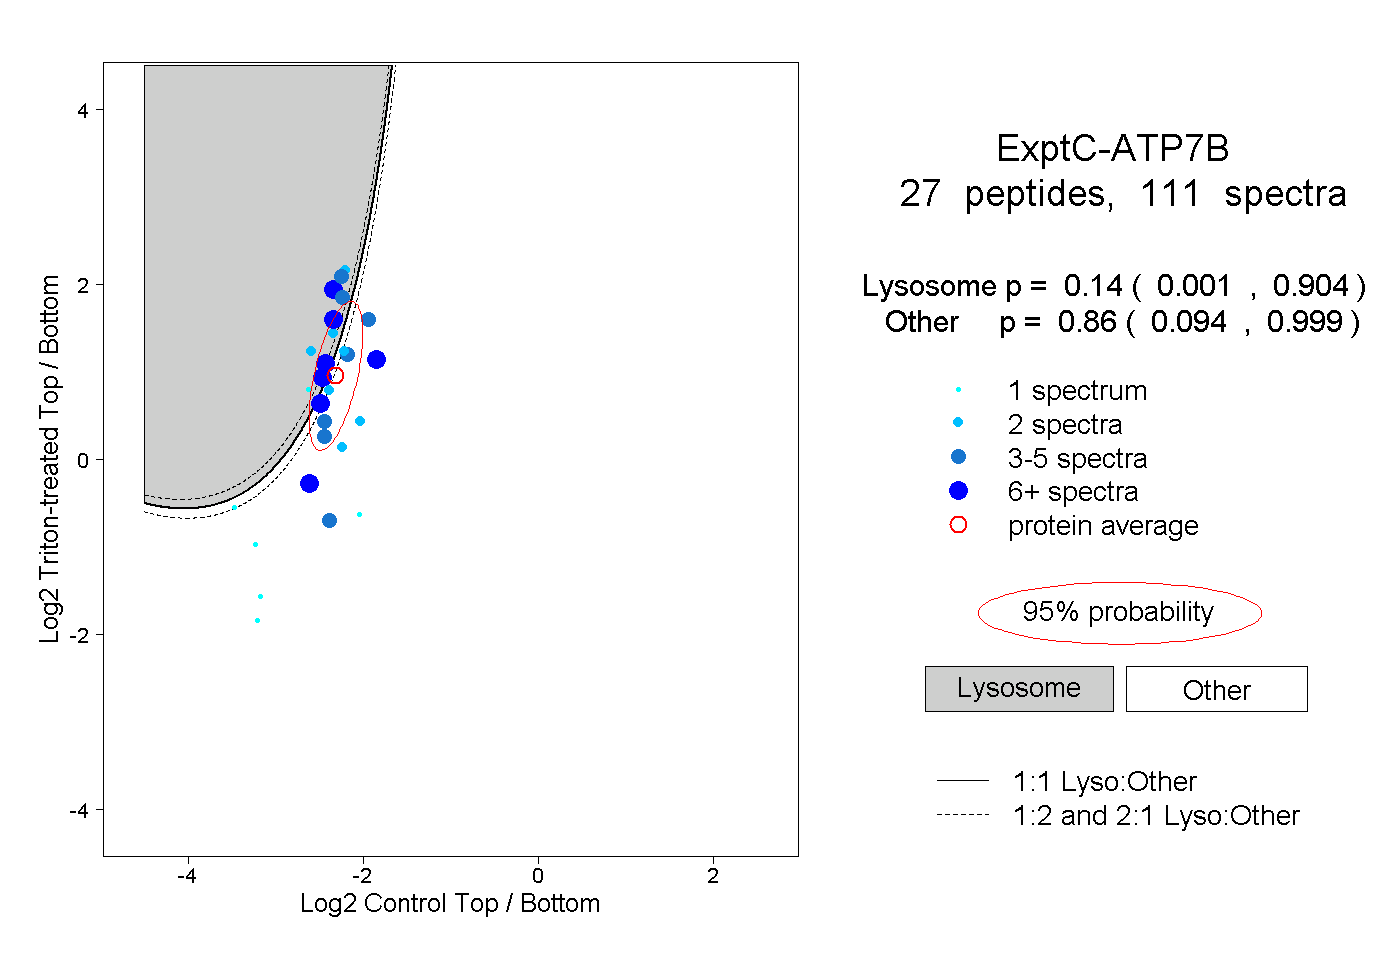
| Expt C |
27
peptides |
111
spectra |
 |
|
0.140
0.001 | 0.904 |
|
|
|
|
|
|
|
0.860
0.094 | 0.999 |
| | | Plot |
|
Lyso |
|
|
|
|
|
|
|
Other |
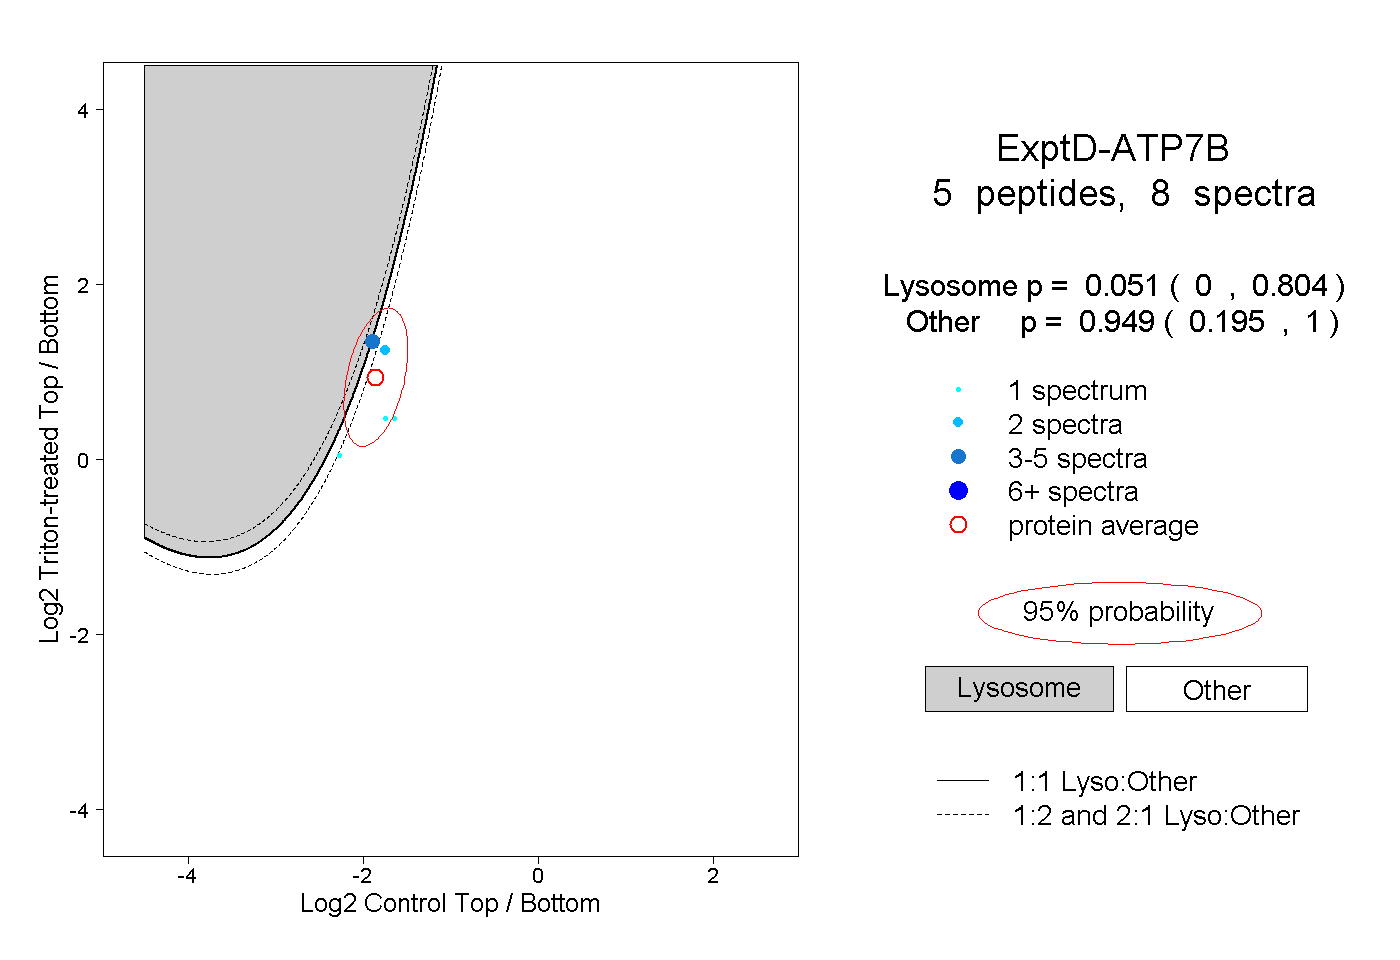
| Expt D |
5
peptides |
8
spectra |
 |
|
0.051
0.000 | 0.804 |
|
|
|
|
|
|
|
0.949
0.195 | 1.000 |