 21
21peptides
spectra
0.000 | 0.000
0.314 | 0.336
0.000 | 0.000
0.000 | 0.000
0.212 | 0.243
0.424 | 0.463
0.000 | 0.000
0.000 | 0.000
| Plot | Mito | Lyso | Perox | ER | Golgi | PM | Cytosol | Nucleus | |||||
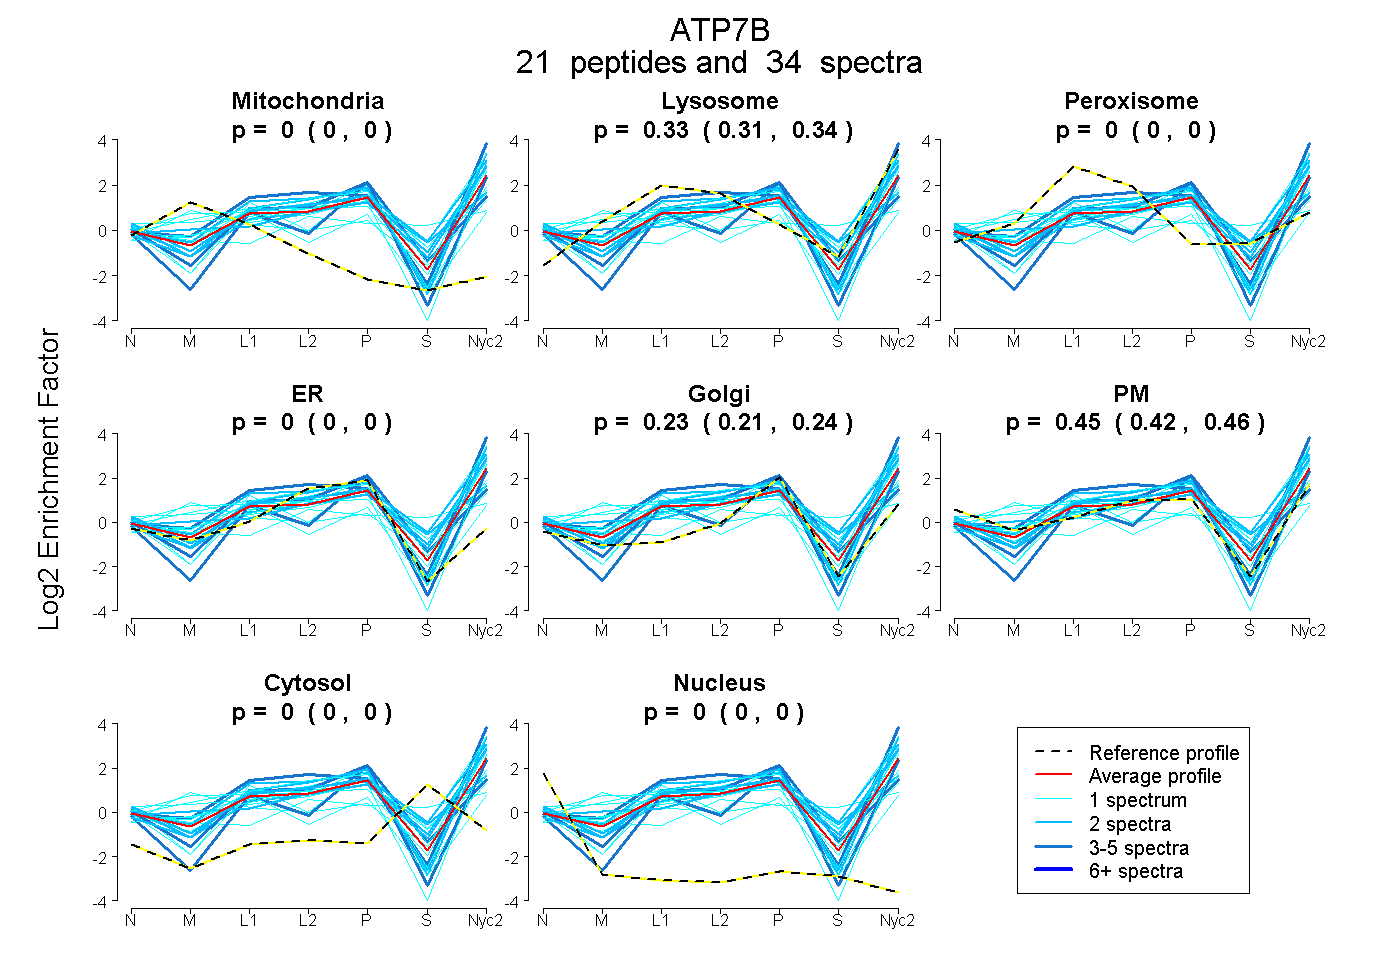
| Expt A |
21 peptides |
34 spectra |
|
0.000 0.000 | 0.000 |
0.326 0.314 | 0.336 |
0.000 0.000 | 0.000 |
0.000 0.000 | 0.000 |
0.229 0.212 | 0.243 |
0.445 0.424 | 0.463 |
0.000 0.000 | 0.000 |
0.000 0.000 | 0.000 |
| 3 spectra, LALPTRPWGQSMK | 0.000 | 0.156 | 0.037 | 0.000 | 0.707 | 0.000 | 0.099 | 0.000 | ||
| 1 spectrum, AASWPSR | 0.272 | 0.369 | 0.000 | 0.000 | 0.299 | 0.060 | 0.000 | 0.000 | ||
| 1 spectrum, FPVDGK | 0.000 | 0.384 | 0.000 | 0.000 | 0.219 | 0.298 | 0.099 | 0.000 | ||
| 1 spectrum, ESGSSSVPSLGSSQR | 0.000 | 0.069 | 0.000 | 0.000 | 0.434 | 0.497 | 0.000 | 0.000 | ||
| 1 spectrum, QQEPGPCR | 0.000 | 0.257 | 0.039 | 0.053 | 0.459 | 0.173 | 0.020 | 0.000 | ||
| 1 spectrum, YFPSPSK | 0.000 | 0.447 | 0.000 | 0.000 | 0.031 | 0.522 | 0.000 | 0.000 | ||
| 2 spectra, VFAEVLPSHK | 0.000 | 0.268 | 0.000 | 0.000 | 0.000 | 0.732 | 0.000 | 0.000 | ||
| 2 spectra, VQELQNK | 0.000 | 0.545 | 0.000 | 0.000 | 0.198 | 0.186 | 0.071 | 0.000 | ||
| 1 spectrum, CFVQIK | 0.000 | 0.229 | 0.110 | 0.103 | 0.276 | 0.189 | 0.093 | 0.000 | ||
| 1 spectrum, VSLPDGLEK | 0.316 | 0.112 | 0.000 | 0.000 | 0.173 | 0.399 | 0.000 | 0.000 | ||
| 1 spectrum, VSNVESILAHR | 0.000 | 0.094 | 0.000 | 0.000 | 0.000 | 0.906 | 0.000 | 0.000 | ||
| 3 spectra, EEQVPMELVQR | 0.000 | 0.541 | 0.000 | 0.000 | 0.000 | 0.459 | 0.000 | 0.000 | ||
| 1 spectrum, GGKPLEMAHK | 0.000 | 0.369 | 0.000 | 0.000 | 0.149 | 0.482 | 0.000 | 0.000 | ||
| 1 spectrum, LVEEAQMSK | 0.000 | 0.617 | 0.000 | 0.000 | 0.222 | 0.115 | 0.046 | 0.000 | ||
| 1 spectrum, TVMFDK | 0.000 | 0.417 | 0.000 | 0.000 | 0.000 | 0.583 | 0.000 | 0.000 | ||
| 2 spectra, DHICDMGFEAAIK | 0.000 | 0.177 | 0.037 | 0.000 | 0.065 | 0.530 | 0.191 | 0.000 | ||
| 1 spectrum, GMTCASCVSNIER | 0.000 | 0.103 | 0.071 | 0.000 | 0.000 | 0.426 | 0.399 | 0.000 | ||
| 2 spectra, YEAQAHGR | 0.000 | 0.413 | 0.000 | 0.000 | 0.207 | 0.363 | 0.017 | 0.000 | ||
| 2 spectra, APIQQLADR | 0.000 | 0.441 | 0.000 | 0.000 | 0.000 | 0.559 | 0.000 | 0.000 | ||
| 4 spectra, TAVLTITGIPR | 0.000 | 0.119 | 0.000 | 0.075 | 0.200 | 0.606 | 0.000 | 0.000 | ||
| 2 spectra, YDPEVIQSPR | 0.000 | 0.363 | 0.000 | 0.000 | 0.011 | 0.581 | 0.045 | 0.000 |
| Plot | Mito | Lyso or Perox | ER | Golgi | PM | Cytosol | Nucleus | ||||||
| Expt B |
5 peptides |
8 spectra |
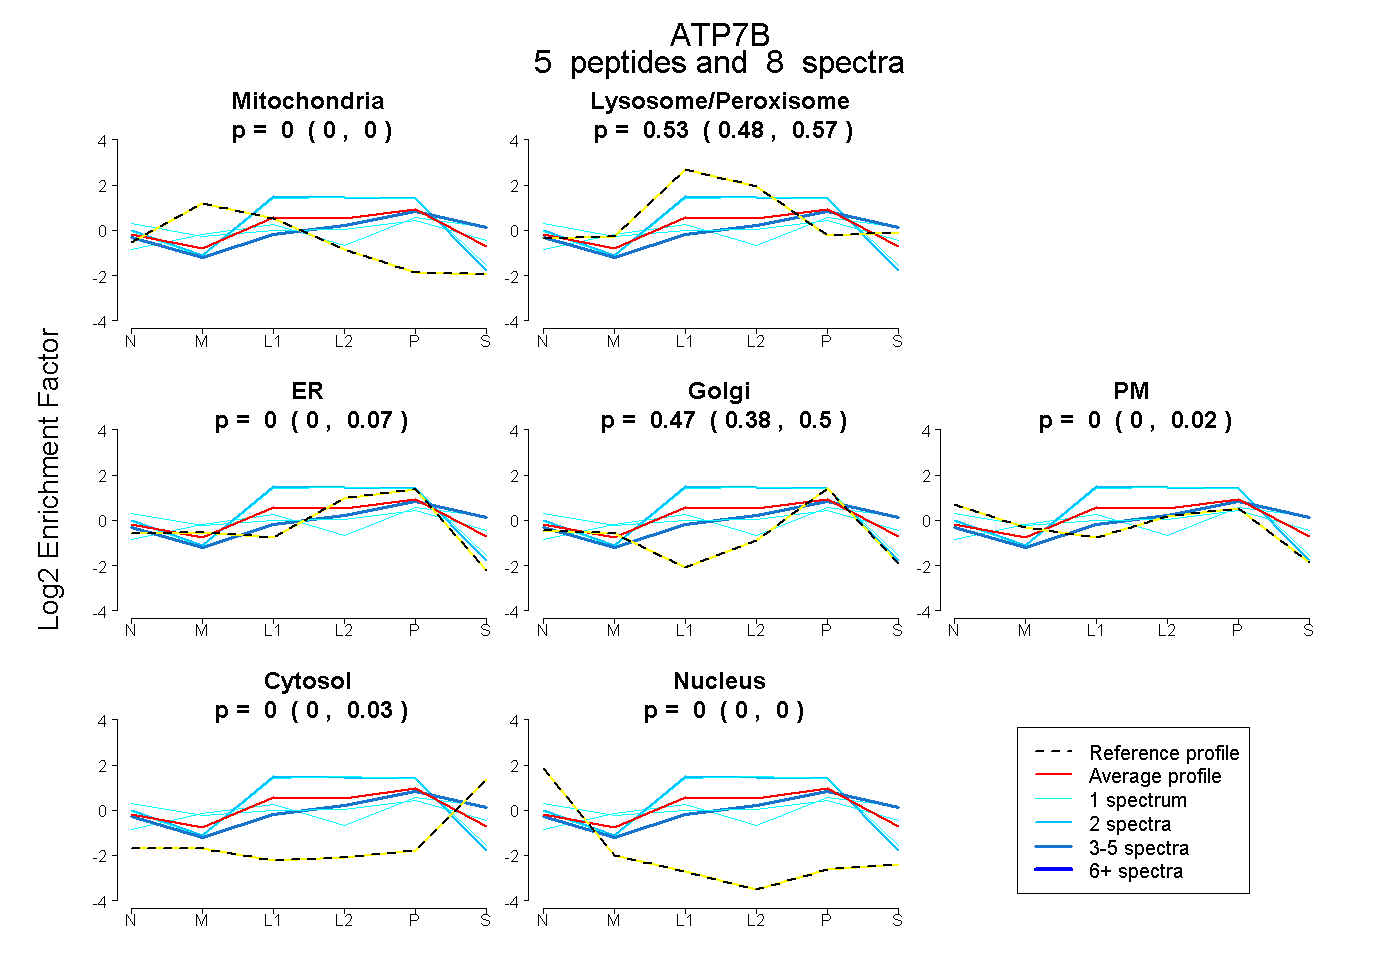 |
0.000 0.000 | 0.000 |
0.531 0.479 | 0.565 |
0.000 0.000 | 0.071 |
0.469 0.378 | 0.497 |
0.000 0.000 | 0.021 |
0.000 0.000 | 0.030 |
0.000 0.000 | 0.003 |
|||
| Plot | Lyso | Other | |||||||||||
| Expt C |
27 peptides |
111 spectra |
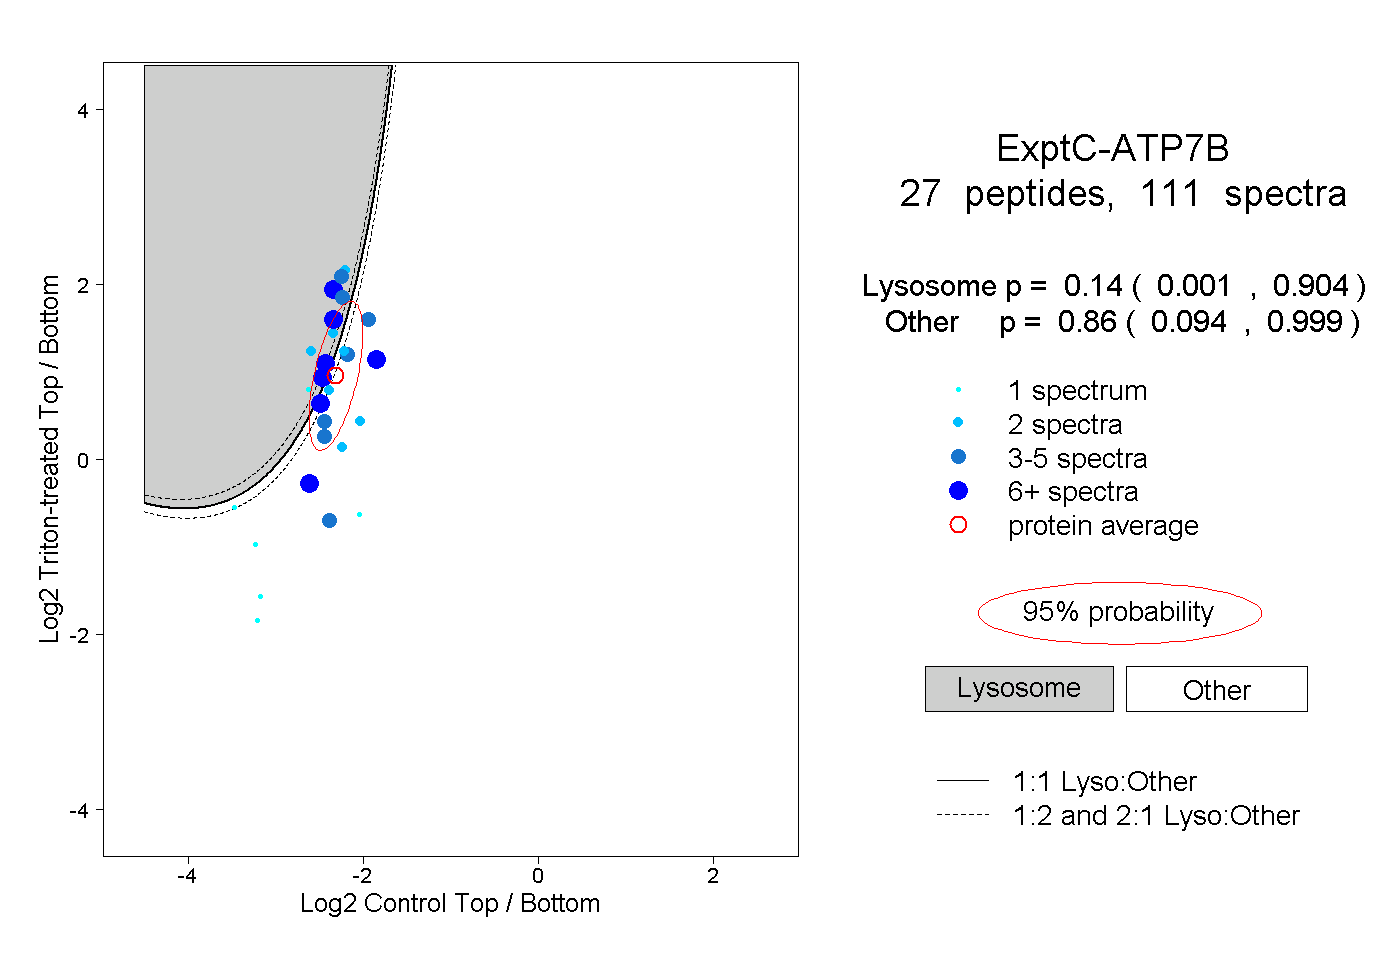 |
0.140 0.001 | 0.904 |
0.860 0.094 | 0.999 |
||||||||
| Plot | Lyso | Other | |||||||||||
| Expt D |
5 peptides |
8 spectra |
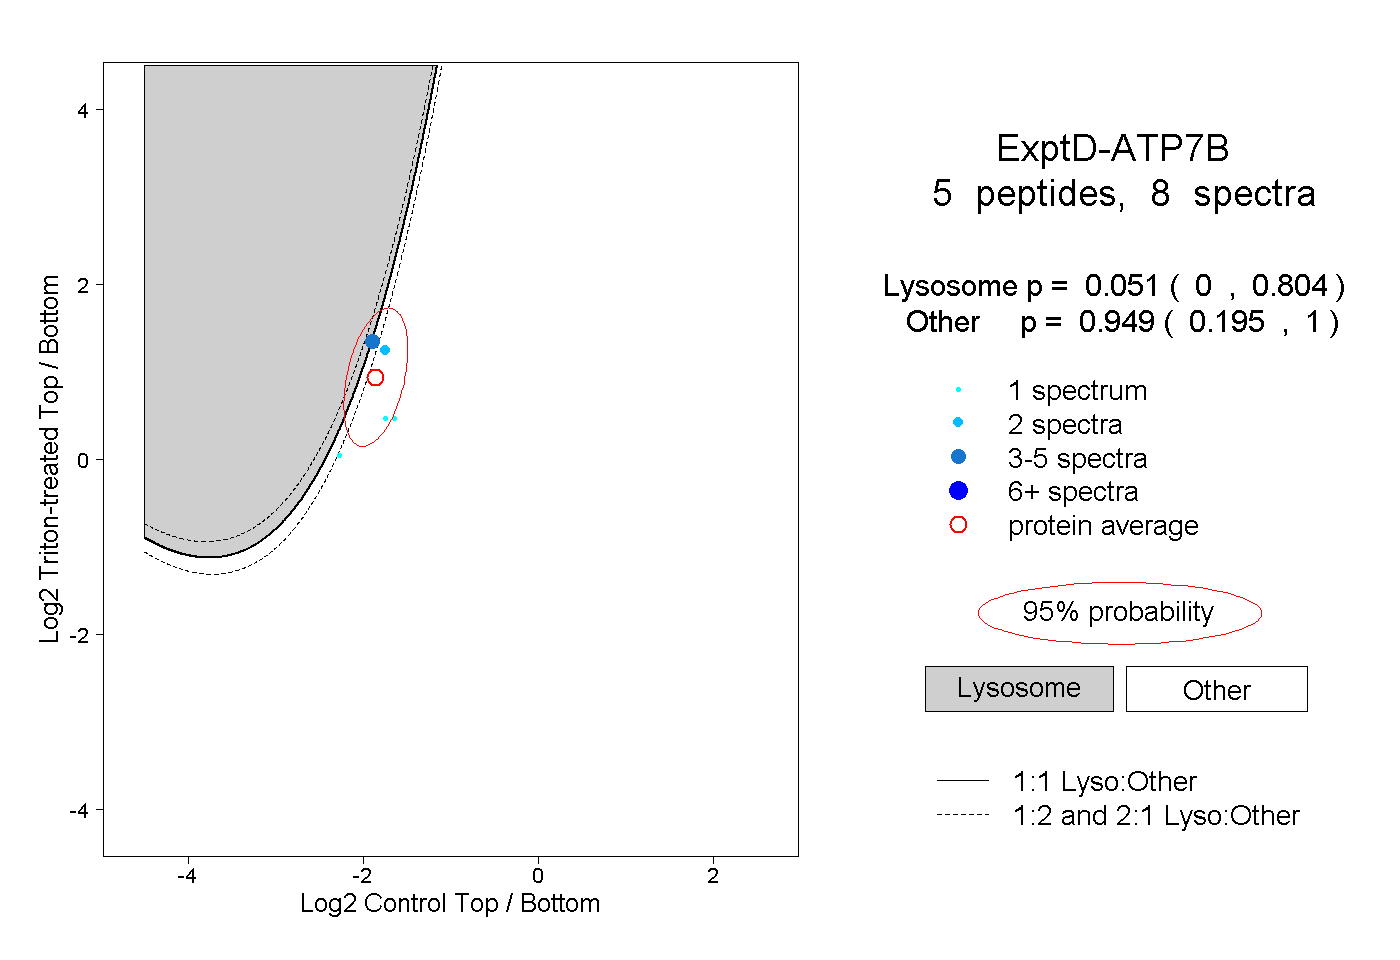 |
0.051 0.000 | 0.804 |
0.949 0.195 | 1.000 |