 2
2peptides
spectra
NA | NA
NA | NA
NA | NA
NA | NA
NA | NA
NA | NA
NA | NA
NA | NA
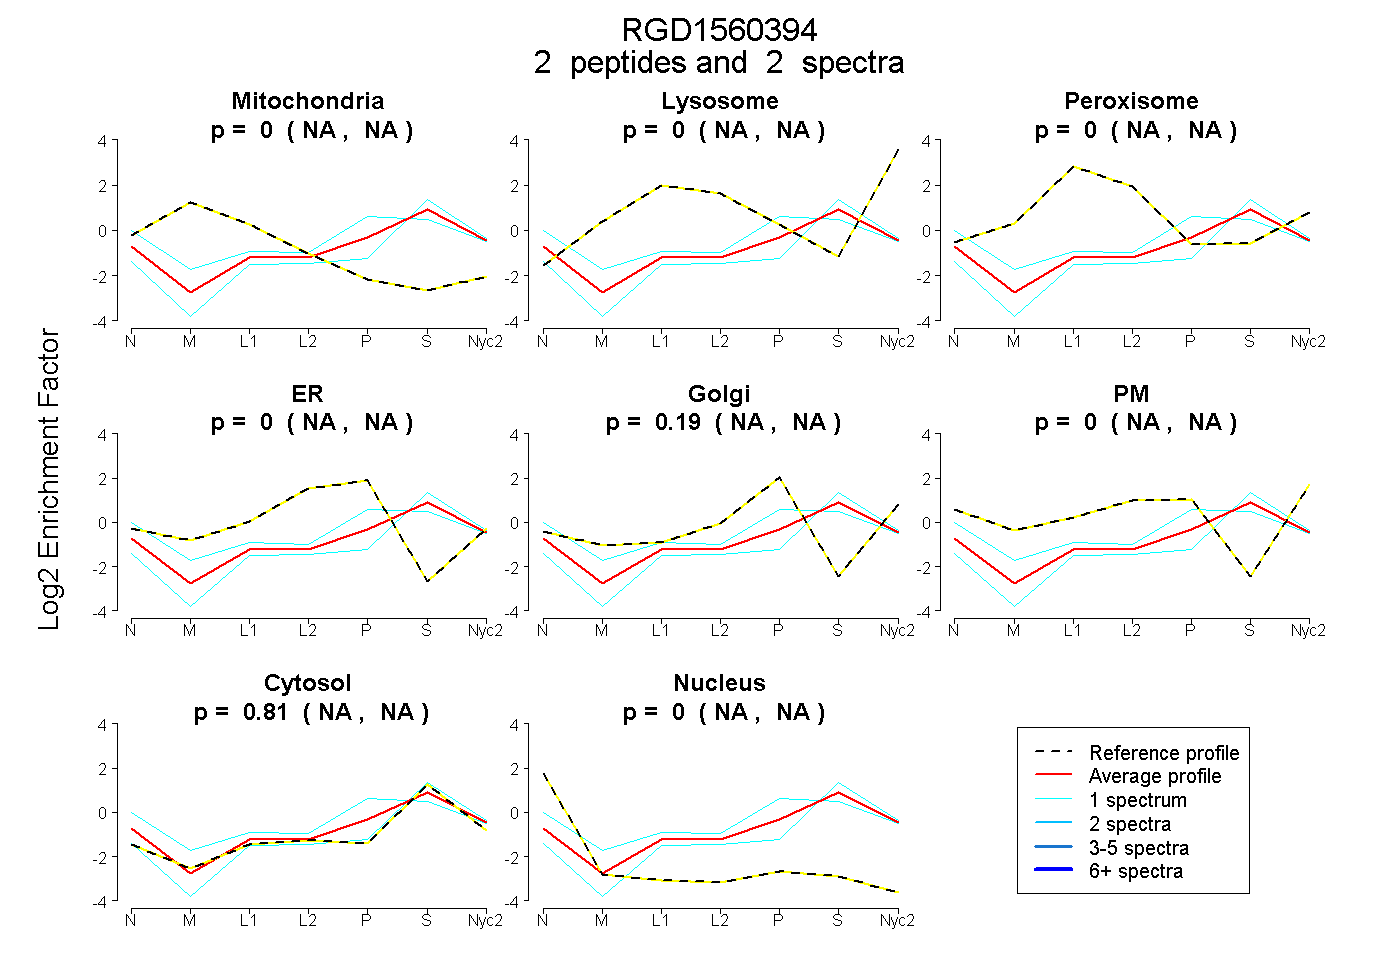
| Plot | Mito | Lyso | Perox | ER | Golgi | PM | Cytosol | Nucleus | |||||
| Expt A |
2 peptides |
2 spectra |
|
0.000 NA | NA |
0.000 NA | NA |
0.000 NA | NA |
0.000 NA | NA |
0.187 NA | NA |
0.000 NA | NA |
0.813 NA | NA |
0.000 NA | NA |
| 1 spectrum, APAPR | 0.000 | 0.000 | 0.000 | 0.034 | 0.317 | 0.051 | 0.593 | 0.006 | ||
| 1 spectrum, MAPAPR | 0.000 | 0.000 | 0.000 | 0.000 | 0.000 | 0.000 | 1.000 | 0.000 |