 5
5peptides
spectra
0.000 | 0.000
0.009 | 0.046
0.018 | 0.058
0.000 | 0.021
0.000 | 0.000
0.895 | 0.938
0.000 | 0.016
0.000 | 0.000
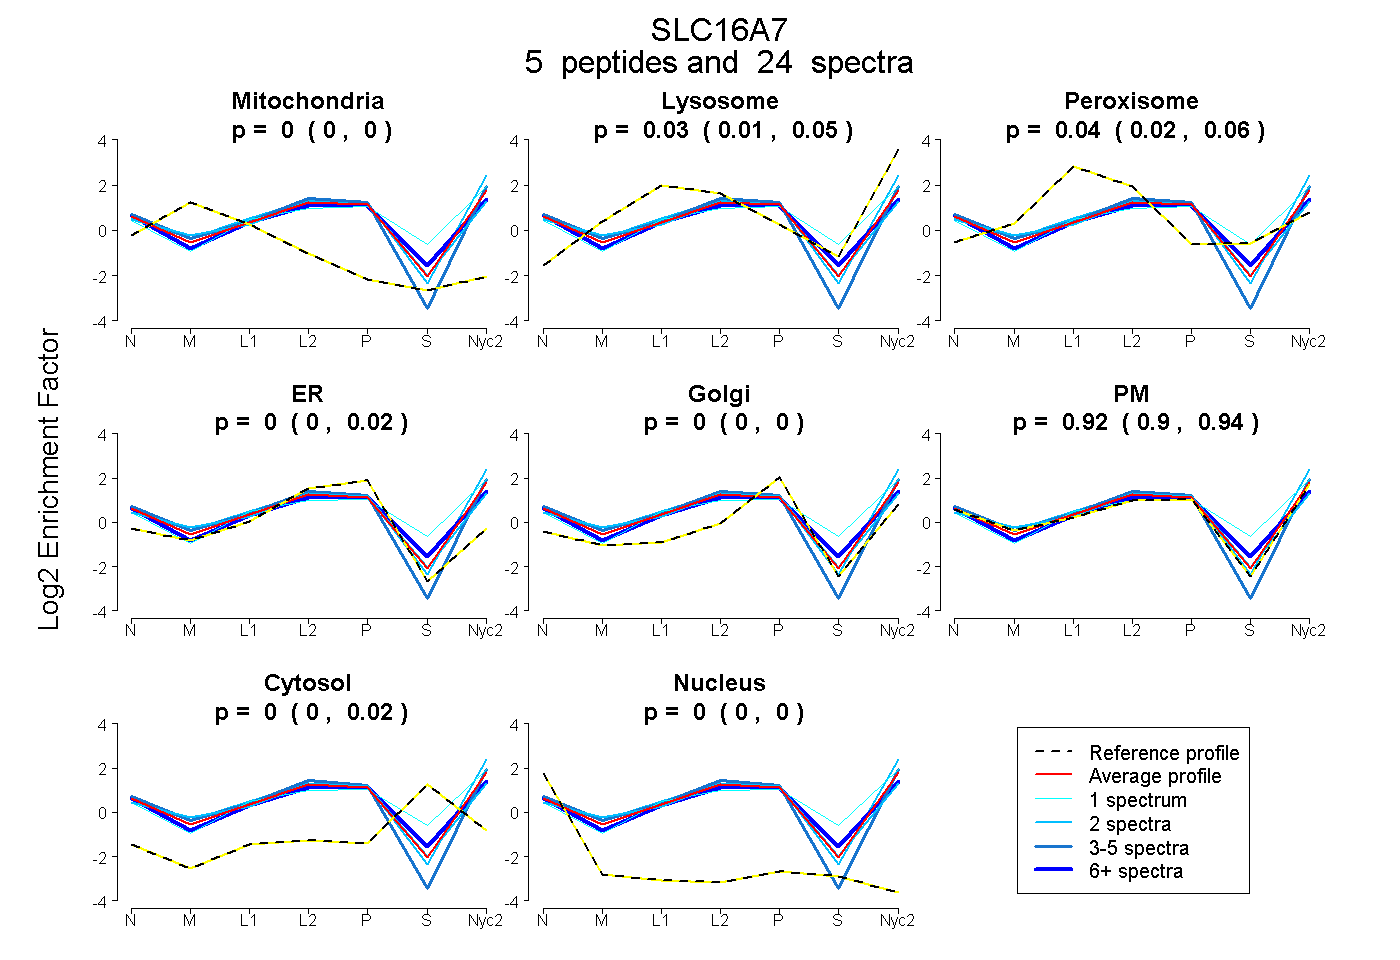
| Plot | Mito | Lyso | Perox | ER | Golgi | PM | Cytosol | Nucleus | |||||
| Expt A |
5 peptides |
24 spectra |
|
0.000 0.000 | 0.000 |
0.026 0.009 | 0.046 |
0.042 0.018 | 0.058 |
0.004 0.000 | 0.021 |
0.000 0.000 | 0.000 |
0.925 0.895 | 0.938 |
0.003 0.000 | 0.016 |
0.000 0.000 | 0.000 |
| 5 spectra, FLDFGLFTHR | 0.000 | 0.000 | 0.000 | 0.000 | 0.000 | 1.000 | 0.000 | 0.000 | ||
| 2 spectra, SASQASK | 0.000 | 0.000 | 0.090 | 0.154 | 0.000 | 0.750 | 0.007 | 0.000 | ||
| 1 spectrum, LLDITGQYK | 0.000 | 0.207 | 0.022 | 0.000 | 0.000 | 0.606 | 0.166 | 0.000 | ||
| 2 spectra, AVTVFFNDIK | 0.000 | 0.141 | 0.000 | 0.000 | 0.000 | 0.859 | 0.000 | 0.000 | ||
| 14 spectra, EMEALSR | 0.000 | 0.000 | 0.079 | 0.051 | 0.000 | 0.787 | 0.083 | 0.000 |
| Plot | Mito | Lyso or Perox | ER | Golgi | PM | Cytosol | Nucleus | ||||||
| Expt B |
1 peptide |
1 spectrum |
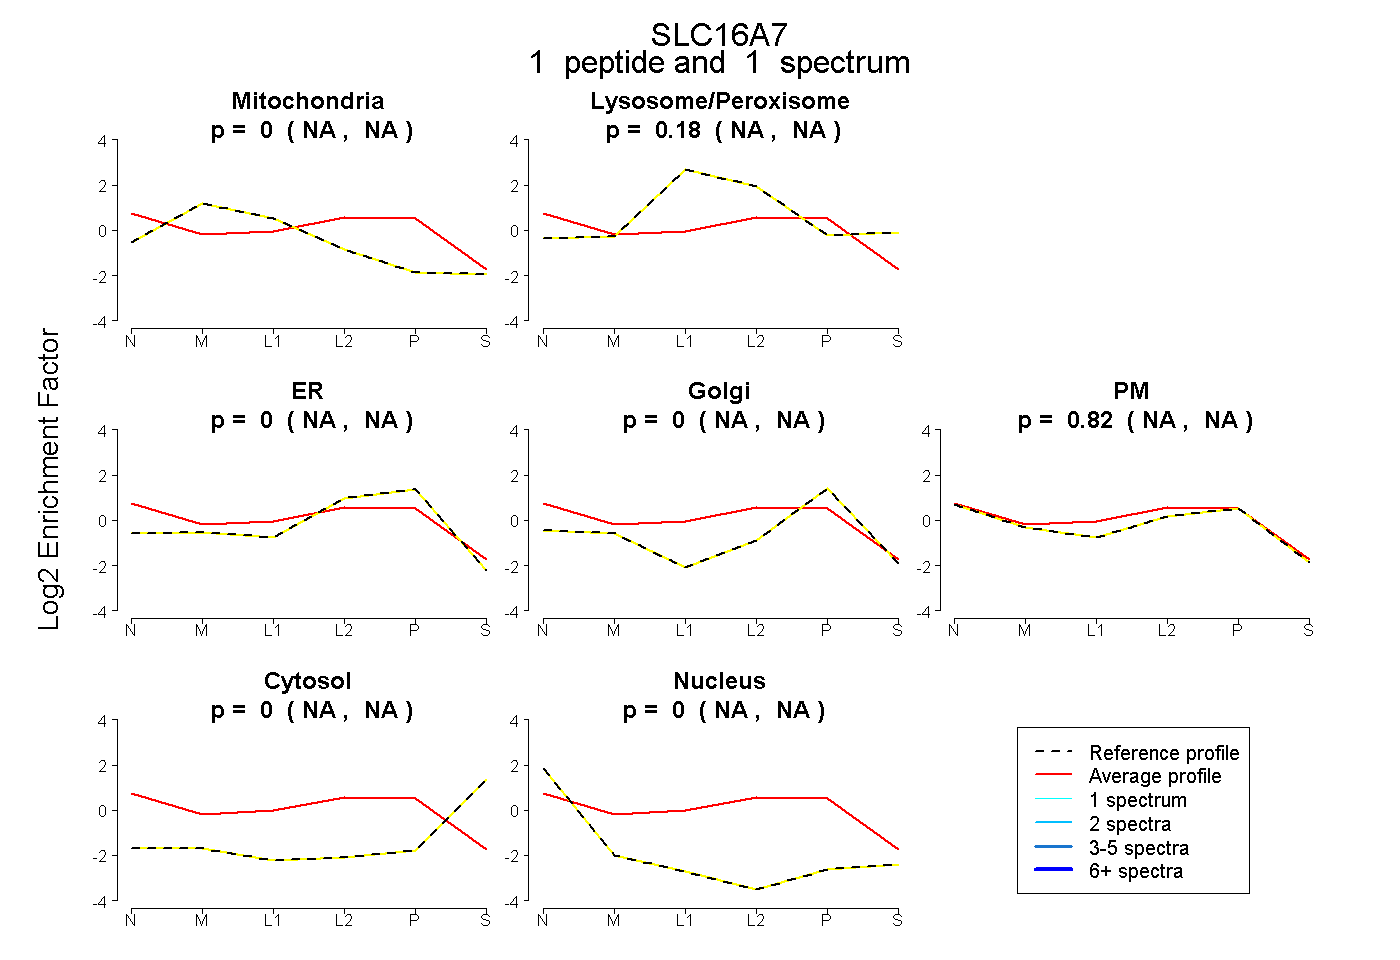 |
0.000 NA | NA |
0.176 NA | NA |
0.000 NA | NA |
0.000 NA | NA |
0.824 NA | NA |
0.000 NA | NA |
0.000 NA | NA |
|||
| Plot | Lyso | Other | |||||||||||
| Expt C |
5 peptides |
38 spectra |
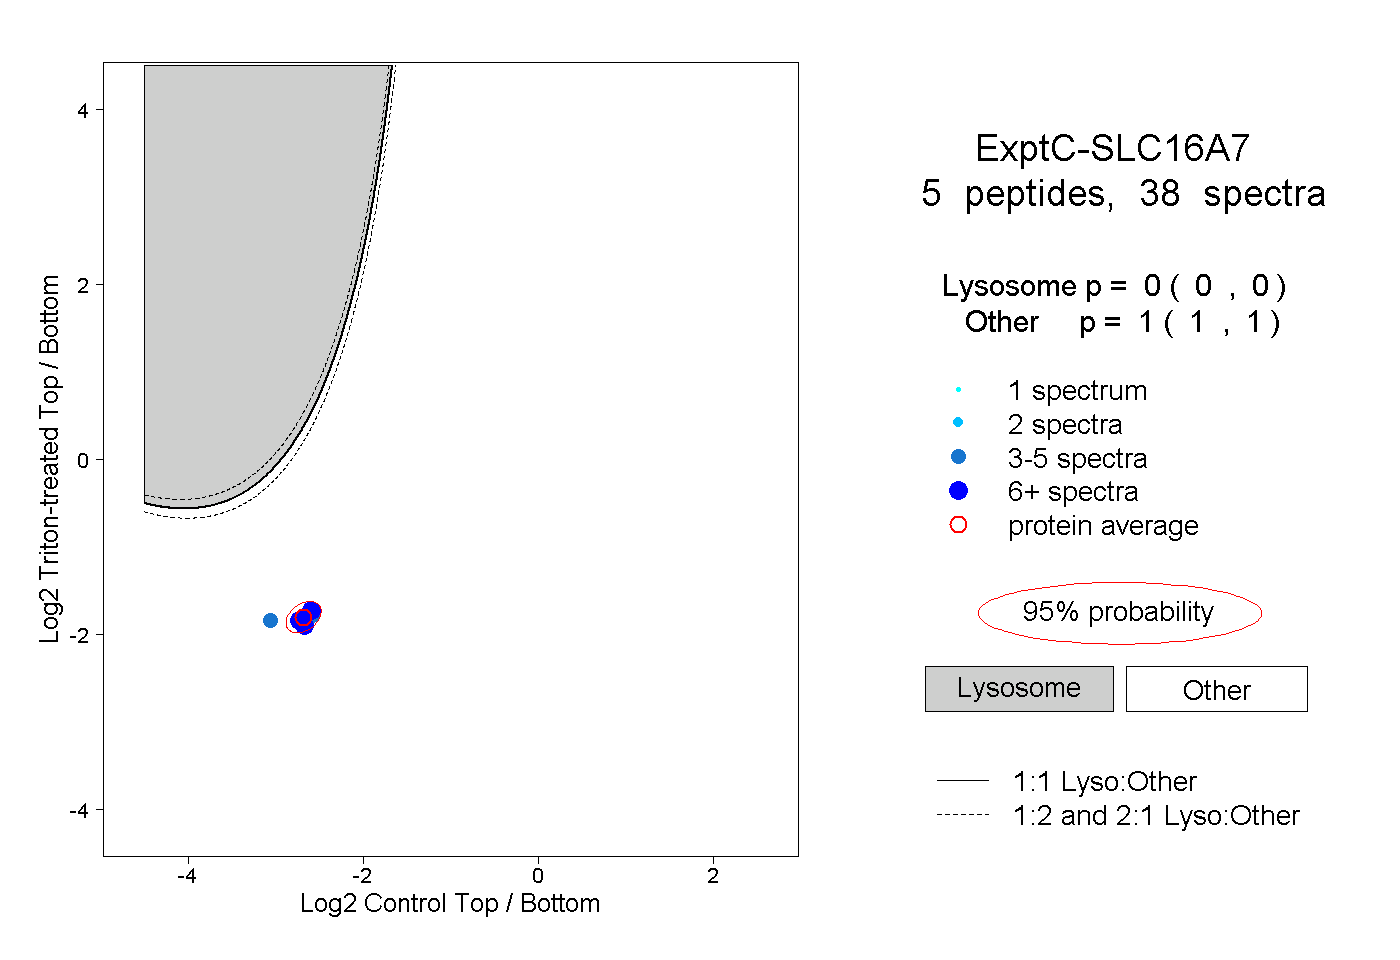 |
0.000 0.000 | 0.000 |
1.000 1.000 | 1.000 |
||||||||
| Plot | Lyso | Other | |||||||||||
| Expt D |
2 peptides |
3 spectra |
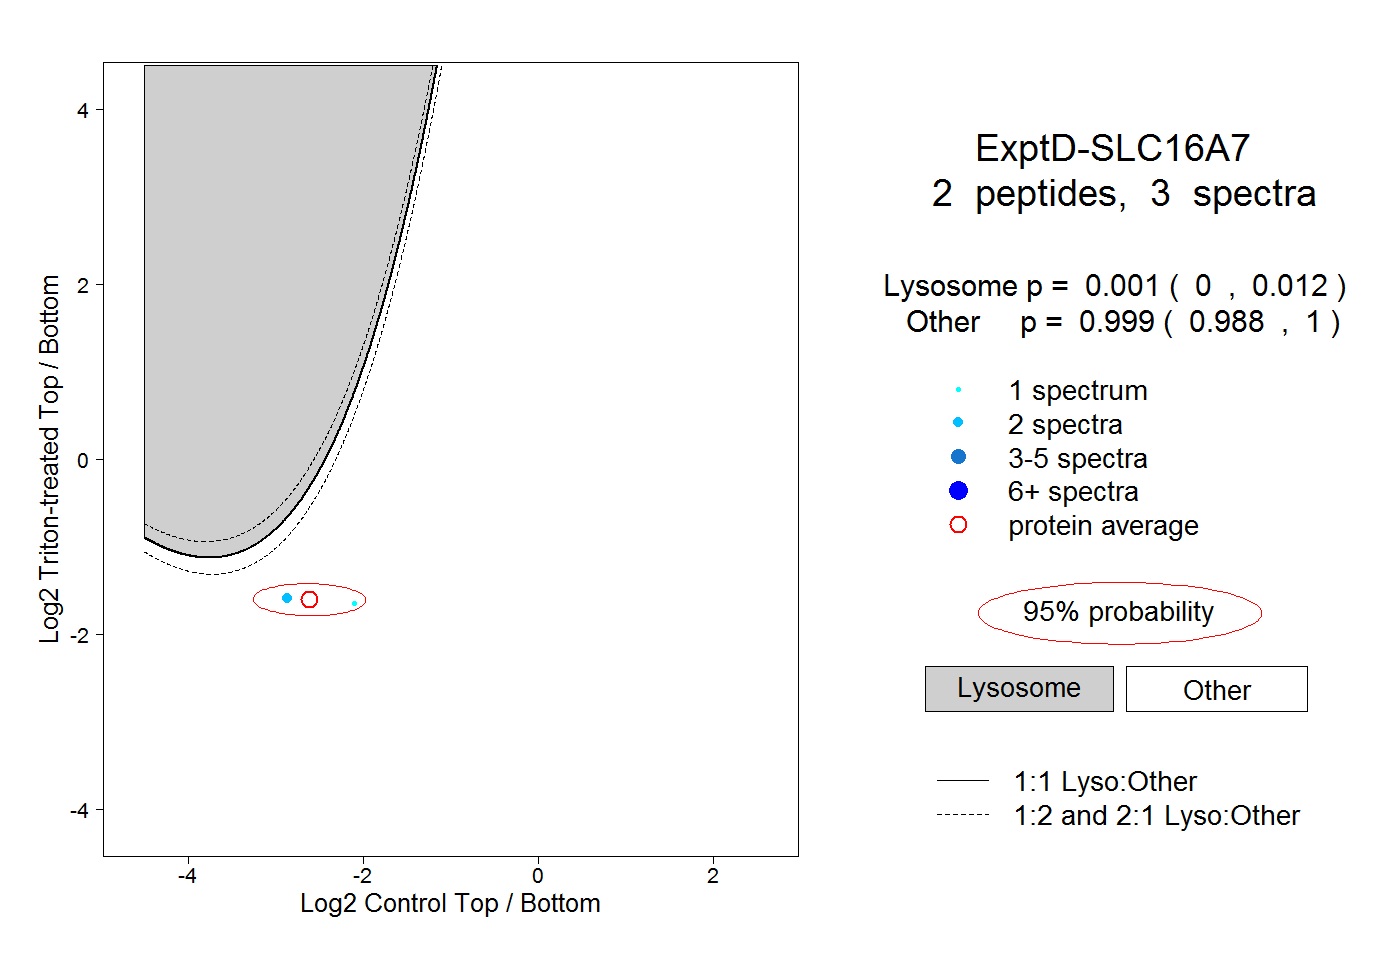 |
0.001 0.000 | 0.012 |
0.999 0.988 | 1.000 |