11
11peptides
spectra
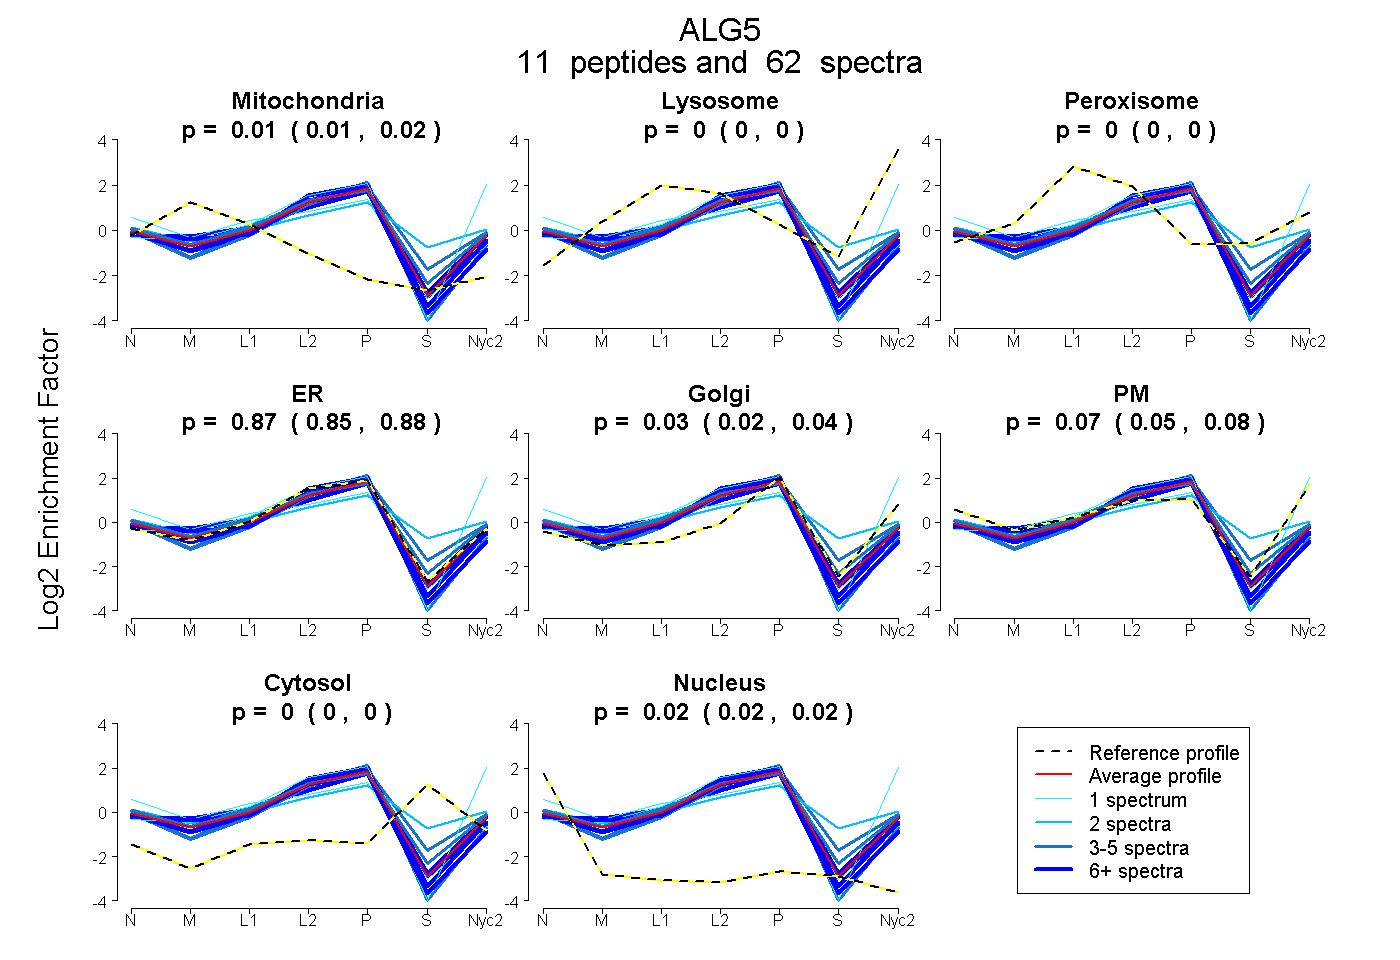
0.005 | 0.017
0.000 | 0.000
0.000 | 0.000
0.849 | 0.882
0.022 | 0.044
0.051 | 0.081
0.000 | 0.000
0.016 | 0.024
7peptides
spectra
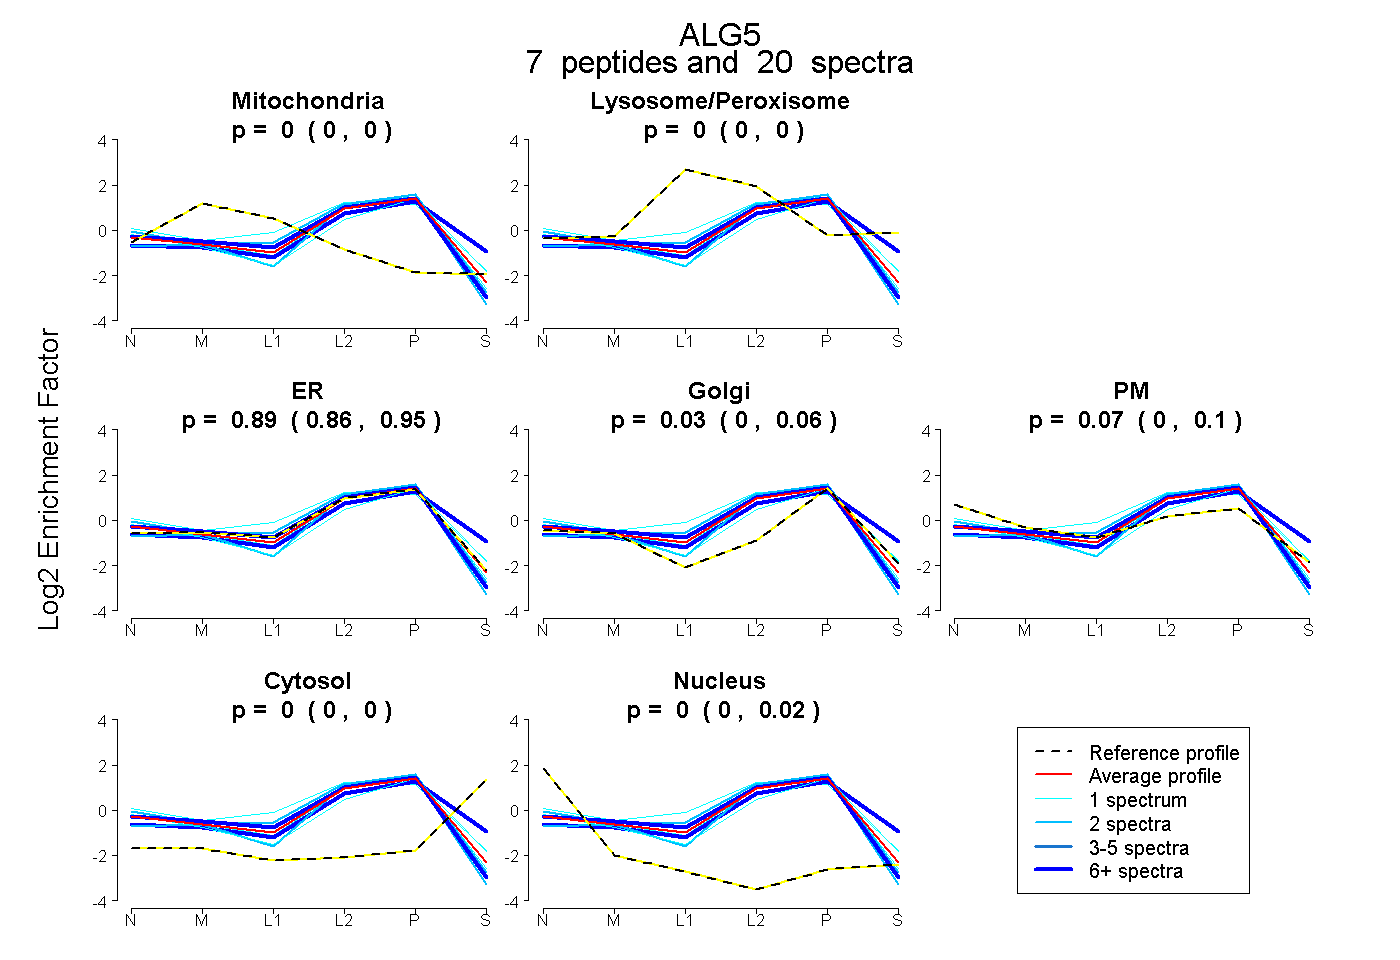
0.000 | 0.000
0.000 | 0.000
0.857 | 0.954
0.000 | 0.058
0.002 | 0.105
0.000 | 0.000
0.000 | 0.020