 11
11peptides
spectra
0.005 | 0.017
0.000 | 0.000
0.000 | 0.000
0.849 | 0.882
0.022 | 0.044
0.051 | 0.081
0.000 | 0.000
0.016 | 0.024
| Plot | Mito | Lyso | Perox | ER | Golgi | PM | Cytosol | Nucleus | |||||
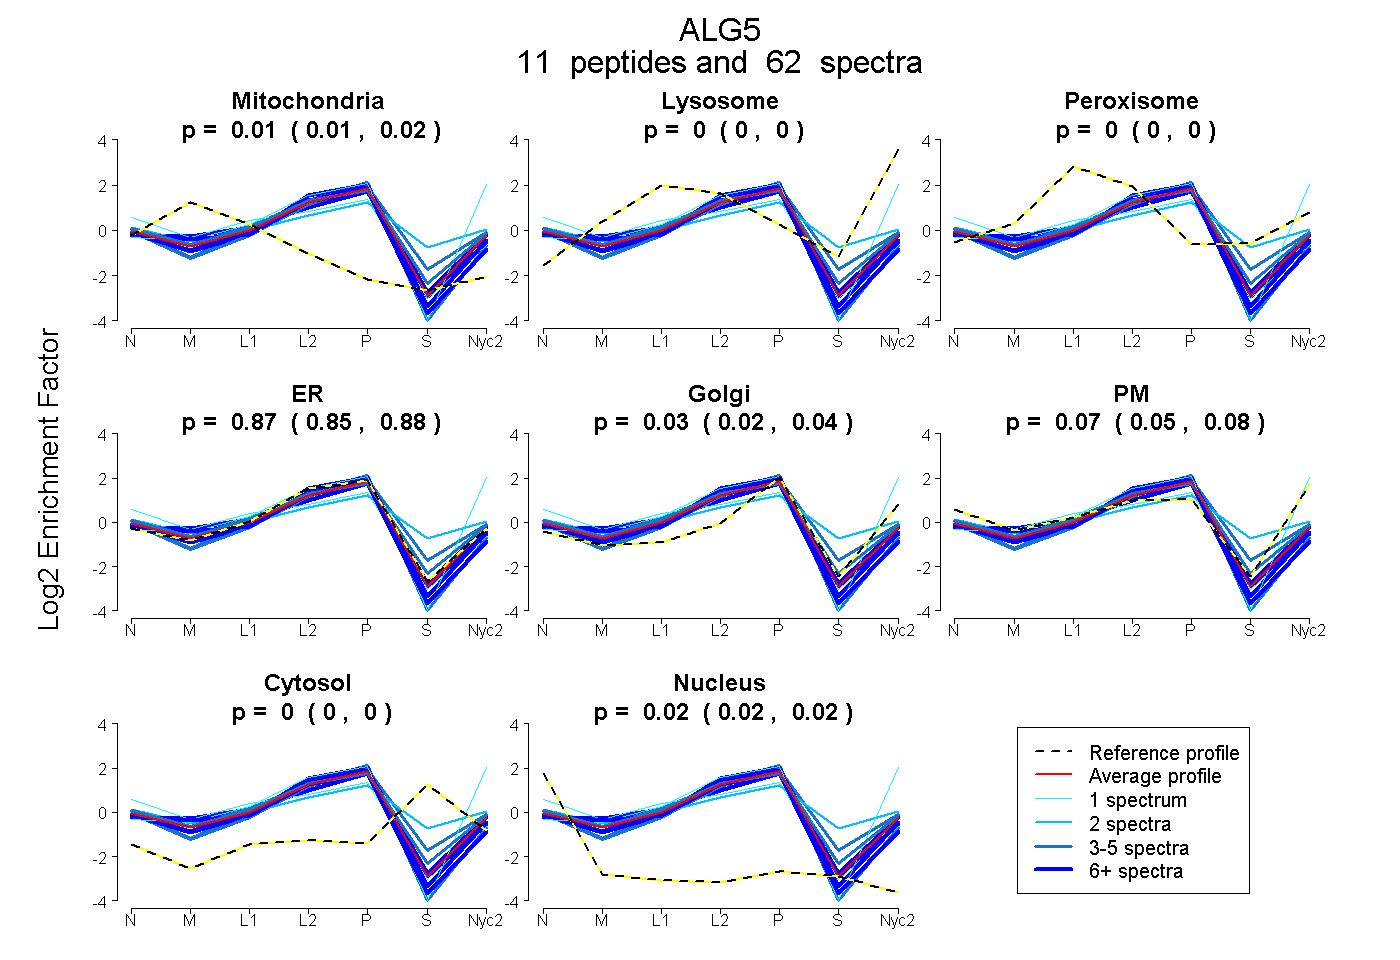
| Expt A |
11 peptides |
62 spectra |
|
0.012 0.005 | 0.017 |
0.000 0.000 | 0.000 |
0.000 0.000 | 0.000 |
0.866 0.849 | 0.882 |
0.034 0.022 | 0.044 |
0.068 0.051 | 0.081 |
0.000 0.000 | 0.000 |
0.020 0.016 | 0.024 |
| 4 spectra, DLLFIR | 0.000 | 0.000 | 0.000 | 0.954 | 0.000 | 0.000 | 0.000 | 0.046 | ||
| 3 spectra, FPDVEK | 0.000 | 0.000 | 0.000 | 0.734 | 0.131 | 0.027 | 0.109 | 0.000 | ||
| 1 spectrum, ESIAQR | 0.154 | 0.000 | 0.000 | 0.705 | 0.000 | 0.113 | 0.000 | 0.028 | ||
| 10 spectra, MGVFSSR | 0.000 | 0.000 | 0.000 | 0.912 | 0.051 | 0.020 | 0.000 | 0.016 | ||
| 5 spectra, YLTGAWR | 0.000 | 0.000 | 0.028 | 0.797 | 0.000 | 0.145 | 0.010 | 0.019 | ||
| 16 spectra, FFLNAR | 0.000 | 0.000 | 0.000 | 0.979 | 0.000 | 0.000 | 0.000 | 0.021 | ||
| 9 spectra, VITLVQNR | 0.075 | 0.000 | 0.000 | 0.901 | 0.000 | 0.000 | 0.000 | 0.025 | ||
| 2 spectra, MPPCHR | 0.000 | 0.000 | 0.165 | 0.343 | 0.133 | 0.152 | 0.207 | 0.000 | ||
| 4 spectra, EALPSIWDSPTK | 0.040 | 0.000 | 0.000 | 0.876 | 0.023 | 0.062 | 0.000 | 0.000 | ||
| 1 spectrum, QLSVVVPSYNEEK | 0.000 | 0.078 | 0.000 | 0.288 | 0.044 | 0.590 | 0.000 | 0.000 | ||
| 7 spectra, DTQCGFK | 0.118 | 0.000 | 0.000 | 0.840 | 0.042 | 0.000 | 0.000 | 0.000 |
| Plot | Mito | Lyso or Perox | ER | Golgi | PM | Cytosol | Nucleus | ||||||
| Expt B |
7 peptides |
20 spectra |
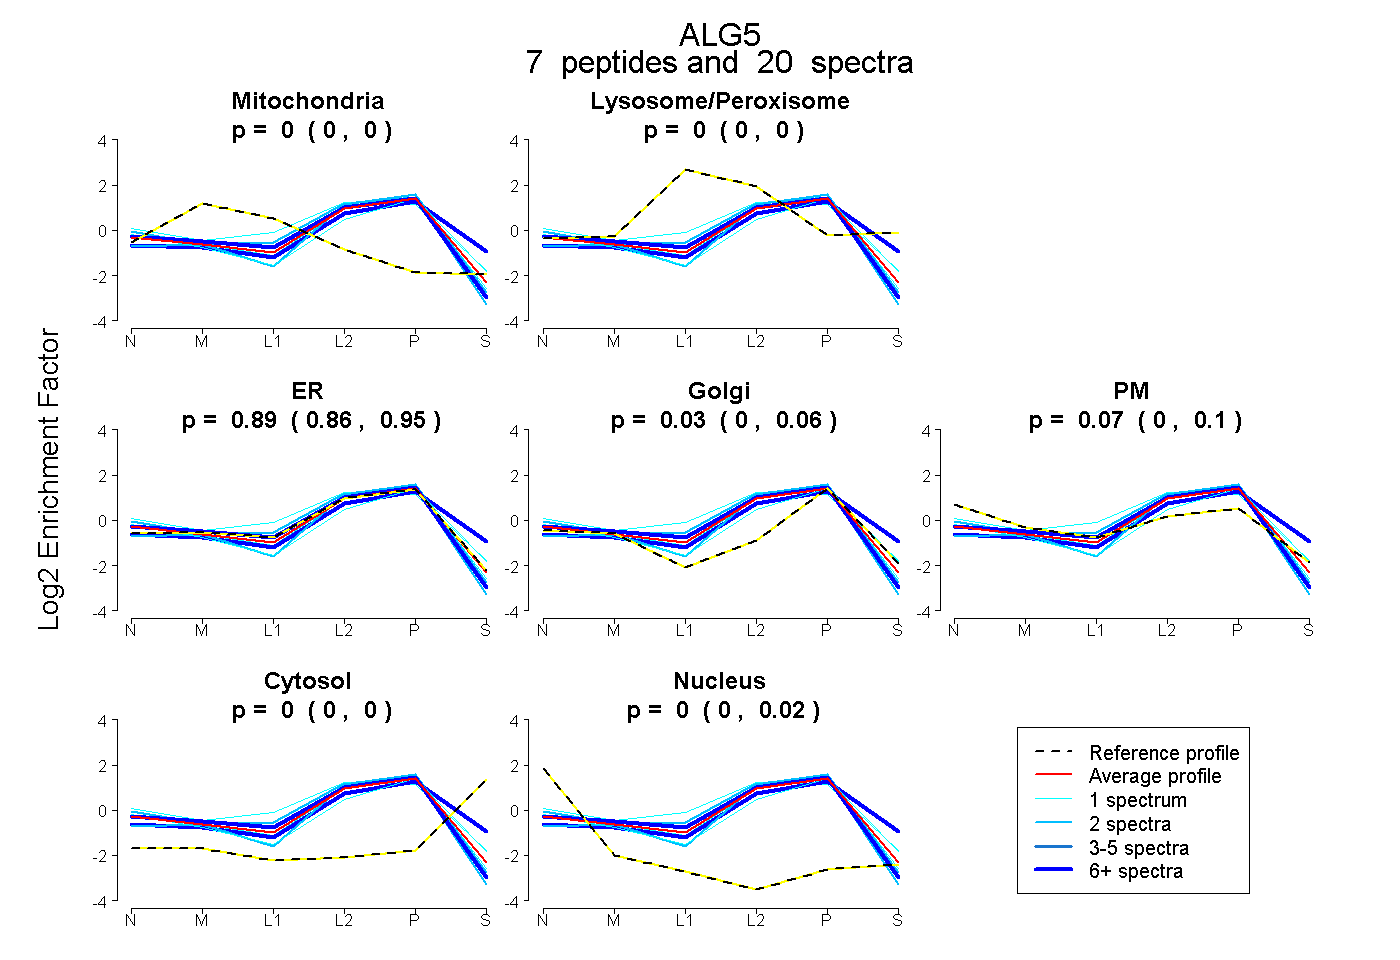 |
0.000 0.000 | 0.000 |
0.000 0.000 | 0.000 |
0.890 0.857 | 0.954 |
0.034 0.000 | 0.058 |
0.075 0.002 | 0.105 |
0.000 0.000 | 0.000 |
0.002 0.000 | 0.020 |
|||
| Plot | Lyso | Other | |||||||||||
| Expt C |
8 peptides |
40 spectra |
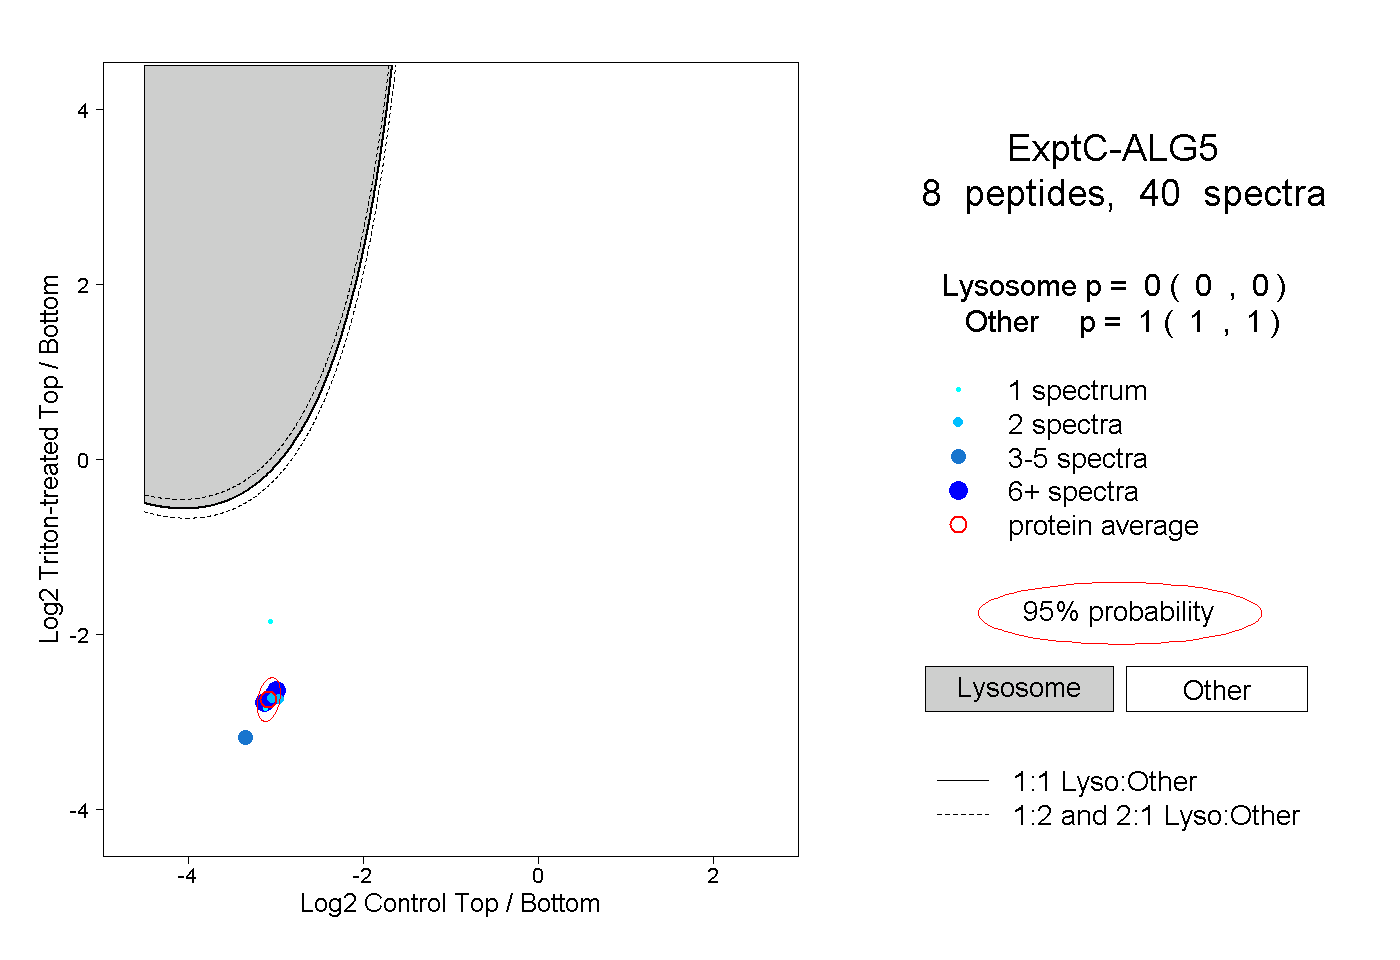 |
0.000 0.000 | 0.000 |
1.000 1.000 | 1.000 |
||||||||
| Plot | Lyso | Other | |||||||||||
| Expt D |
4 peptides |
5 spectra |
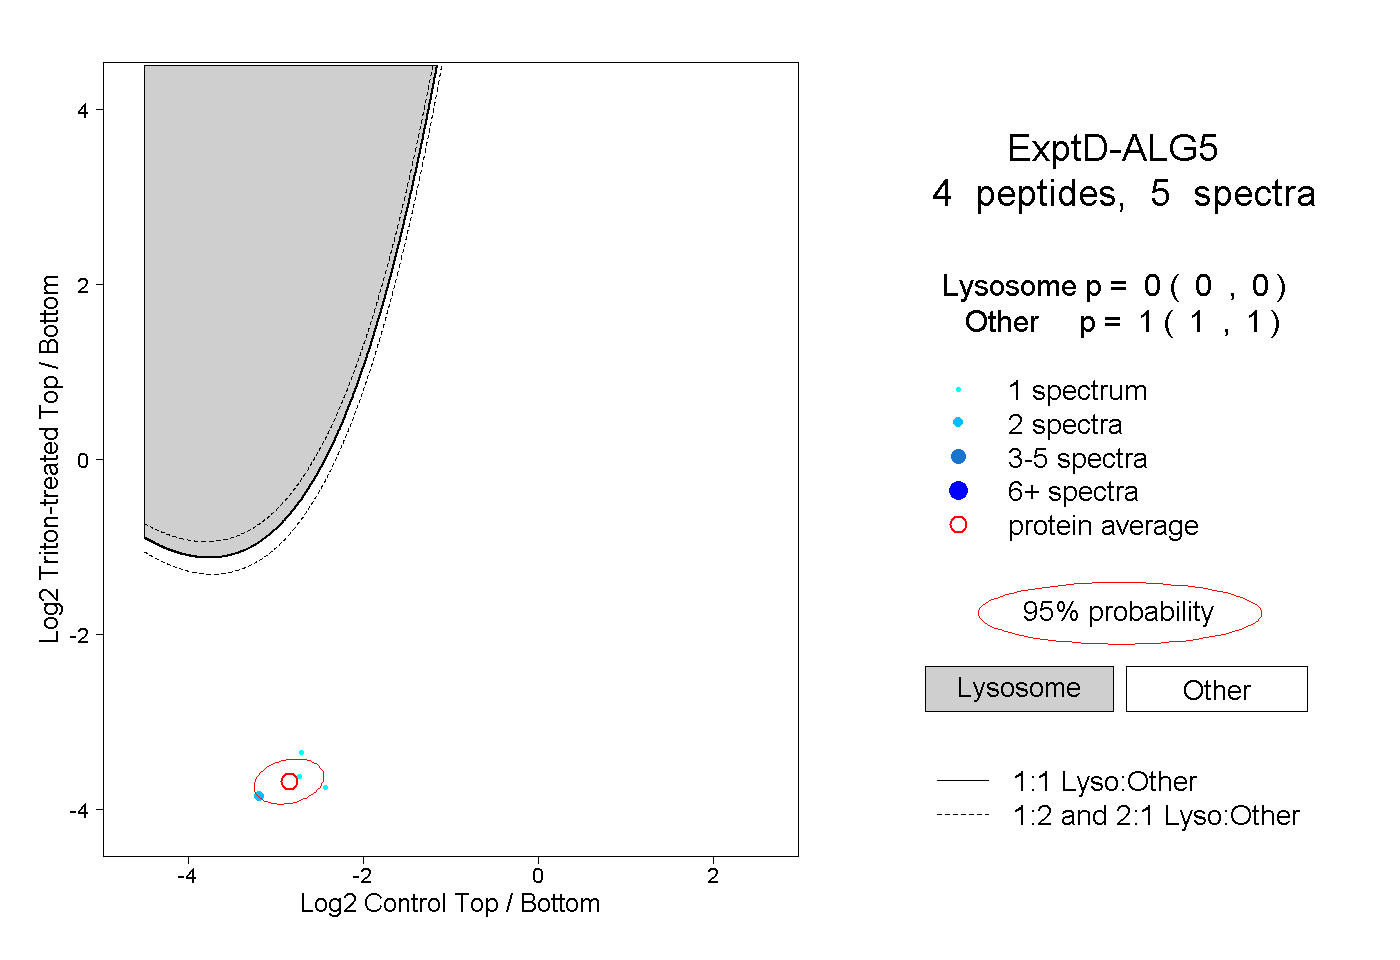 |
0.000 0.000 | 0.000 |
1.000 1.000 | 1.000 |