 1
1peptide
spectra
0.000 | 0.104
0.000 | 0.306
0.000 | 0.218
0.000 | 0.037
0.000 | 0.034
0.000 | 0.069
0.617 | 0.782
0.000 | 0.041
1peptide
spectra
0.000 | 0.000
1.000 | 1.000
| Plot | Mito | Lyso | Perox | ER | Golgi | PM | Cytosol | Nucleus | |||||
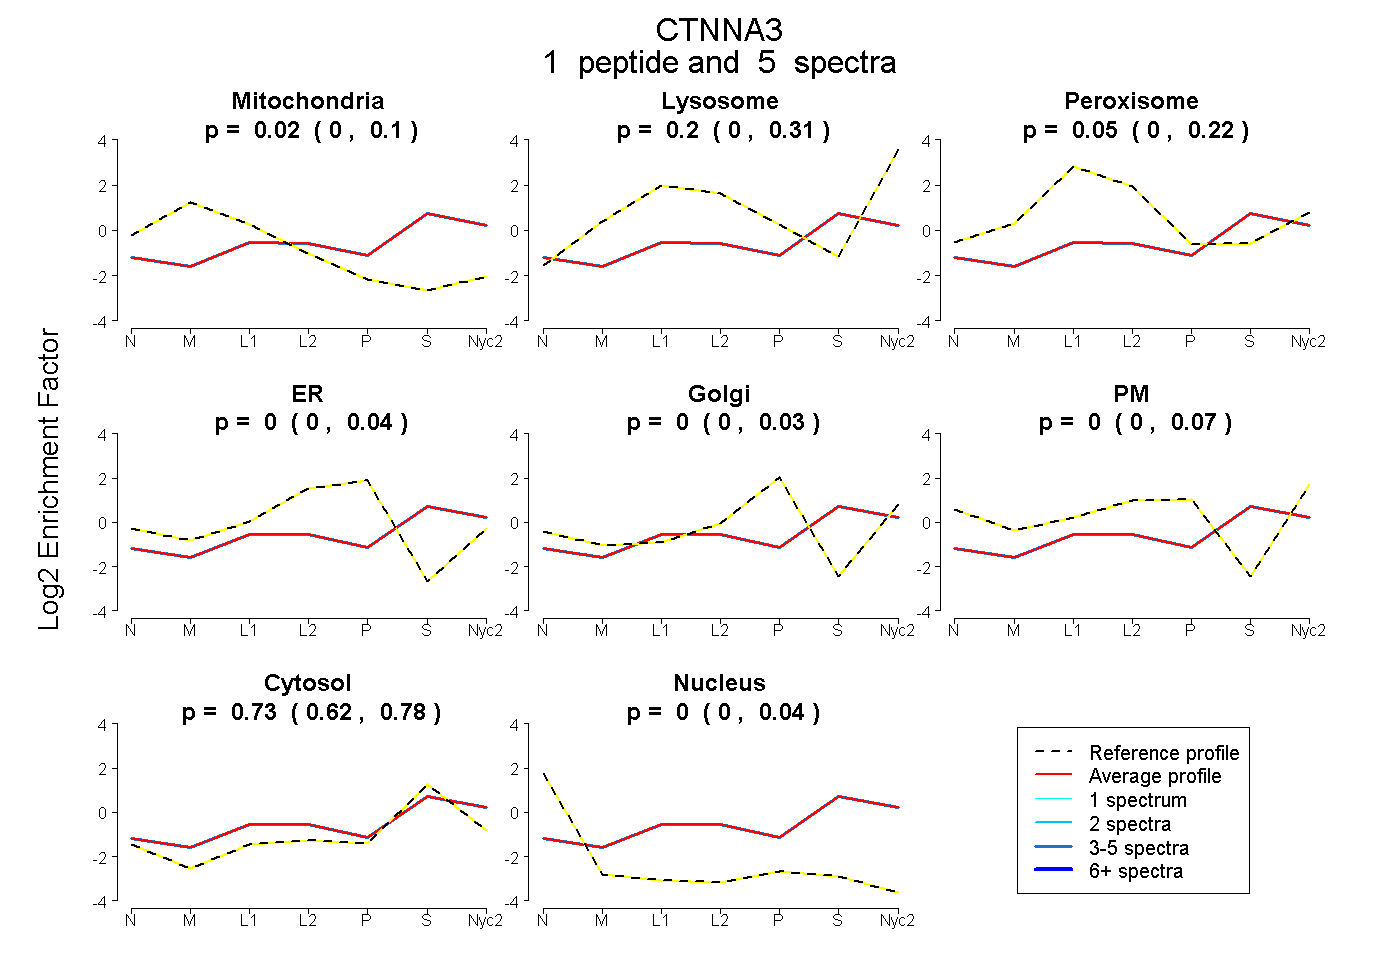
| Expt A |
1 peptide |
5 spectra |
|
0.024 0.000 | 0.104 |
0.199 0.000 | 0.306 |
0.051 0.000 | 0.218 |
0.000 0.000 | 0.037 |
0.000 0.000 | 0.034 |
0.000 0.000 | 0.069 |
0.725 0.617 | 0.782 |
0.000 0.000 | 0.041 |
||
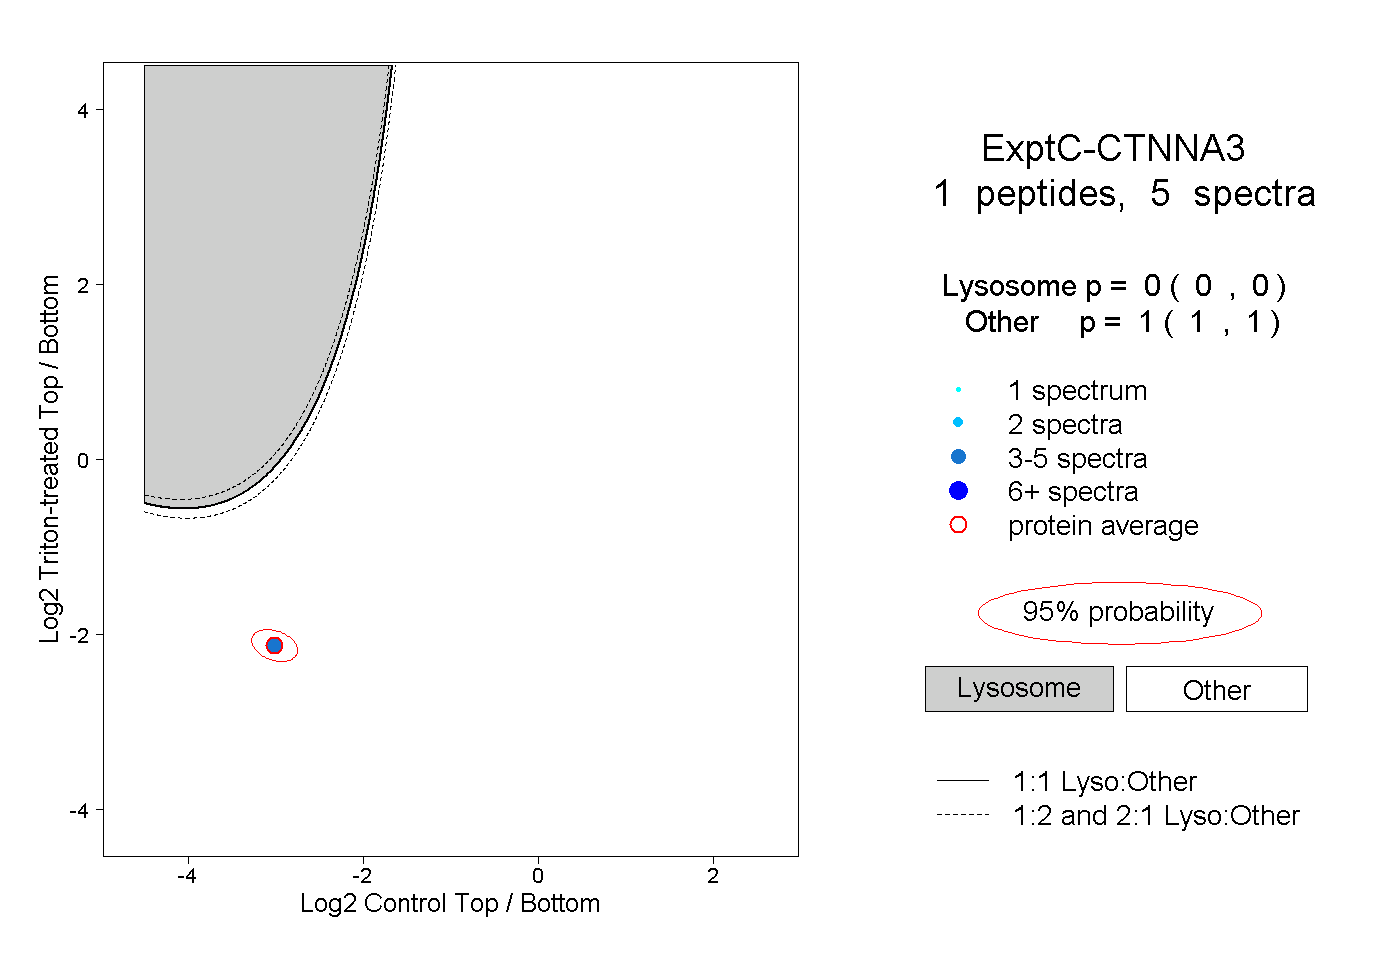
| Plot | Lyso | Other | |||||||||||
| Expt C |
1 peptide |
5 spectra |
|
0.000 0.000 | 0.000 |
1.000 1.000 | 1.000 |