 4
4peptides
spectra
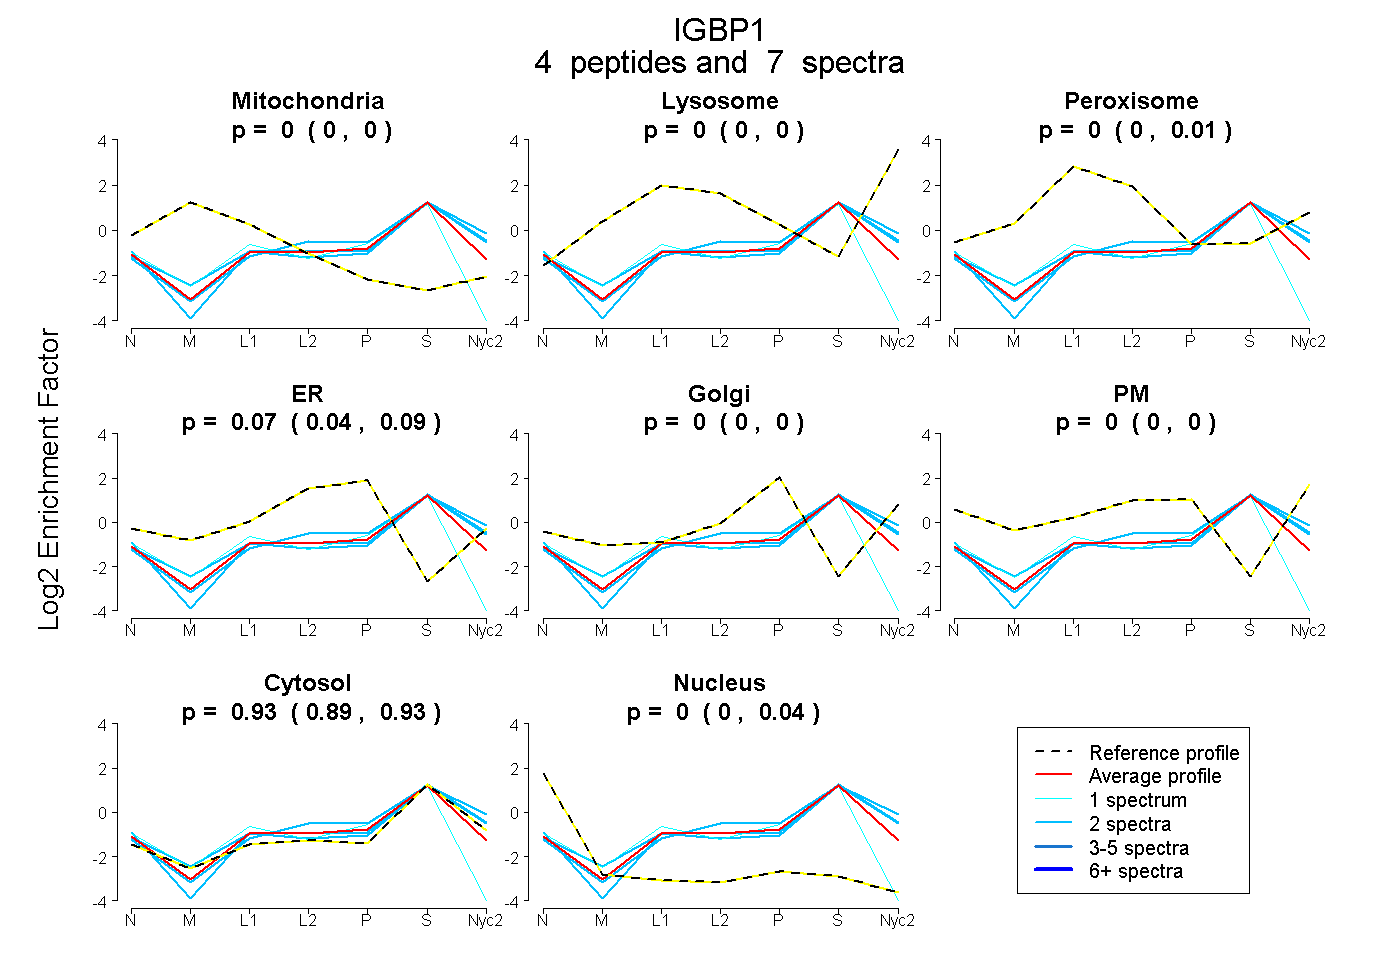
0.000 | 0.000
0.000 | 0.000
0.000 | 0.008
0.044 | 0.087
0.000 | 0.000
0.000 | 0.000
0.892 | 0.933
0.000 | 0.040
3peptides
spectra
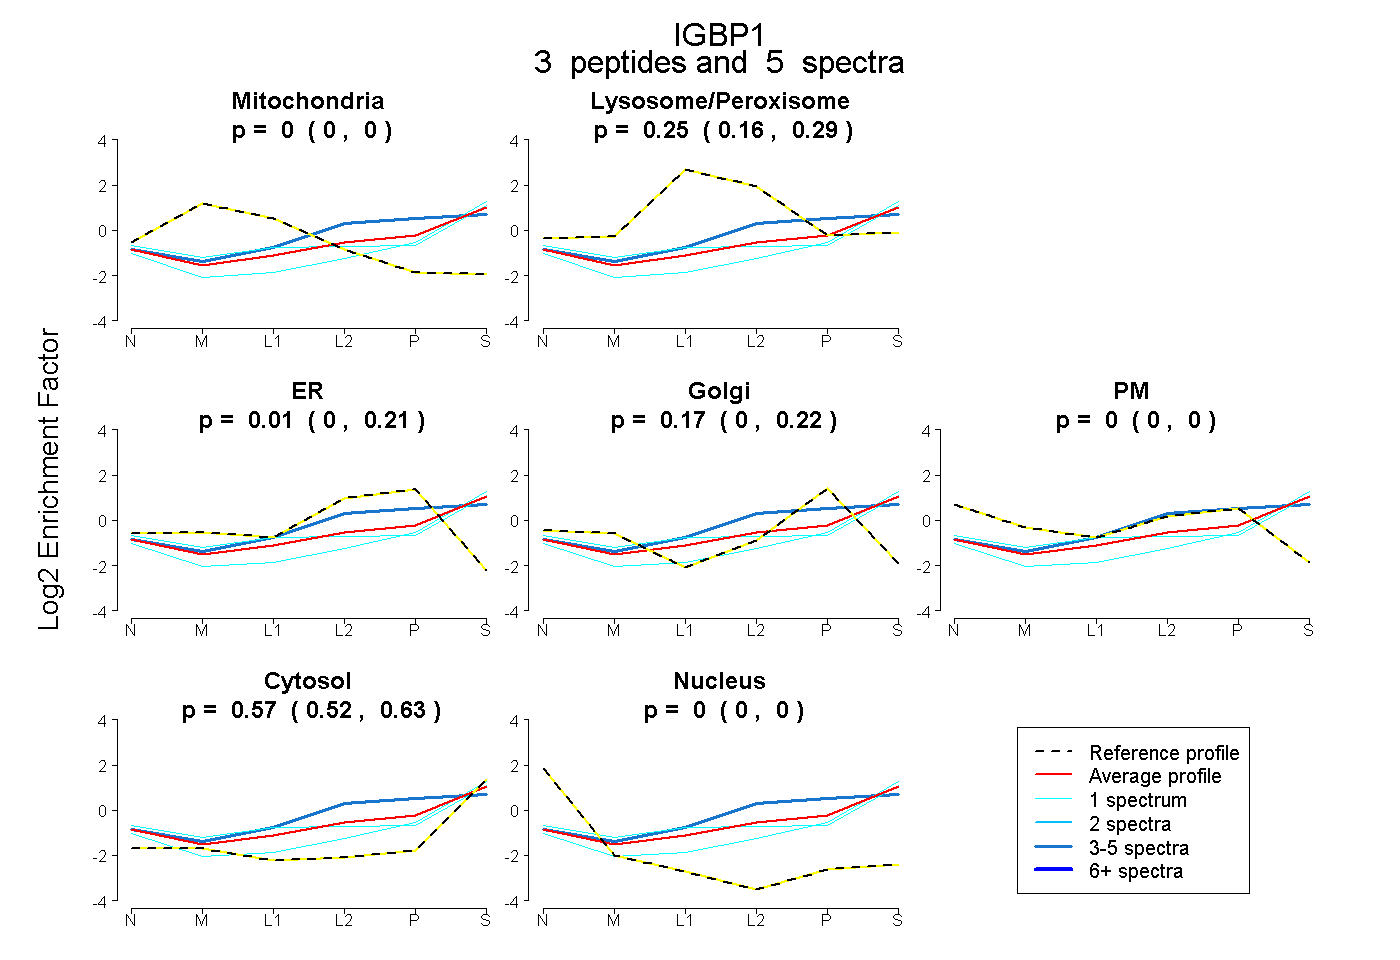
0.000 | 0.000
0.156 | 0.291
0.000 | 0.209
0.000 | 0.219
0.000 | 0.000
0.523 | 0.628
0.000 | 0.000
5peptides
spectra
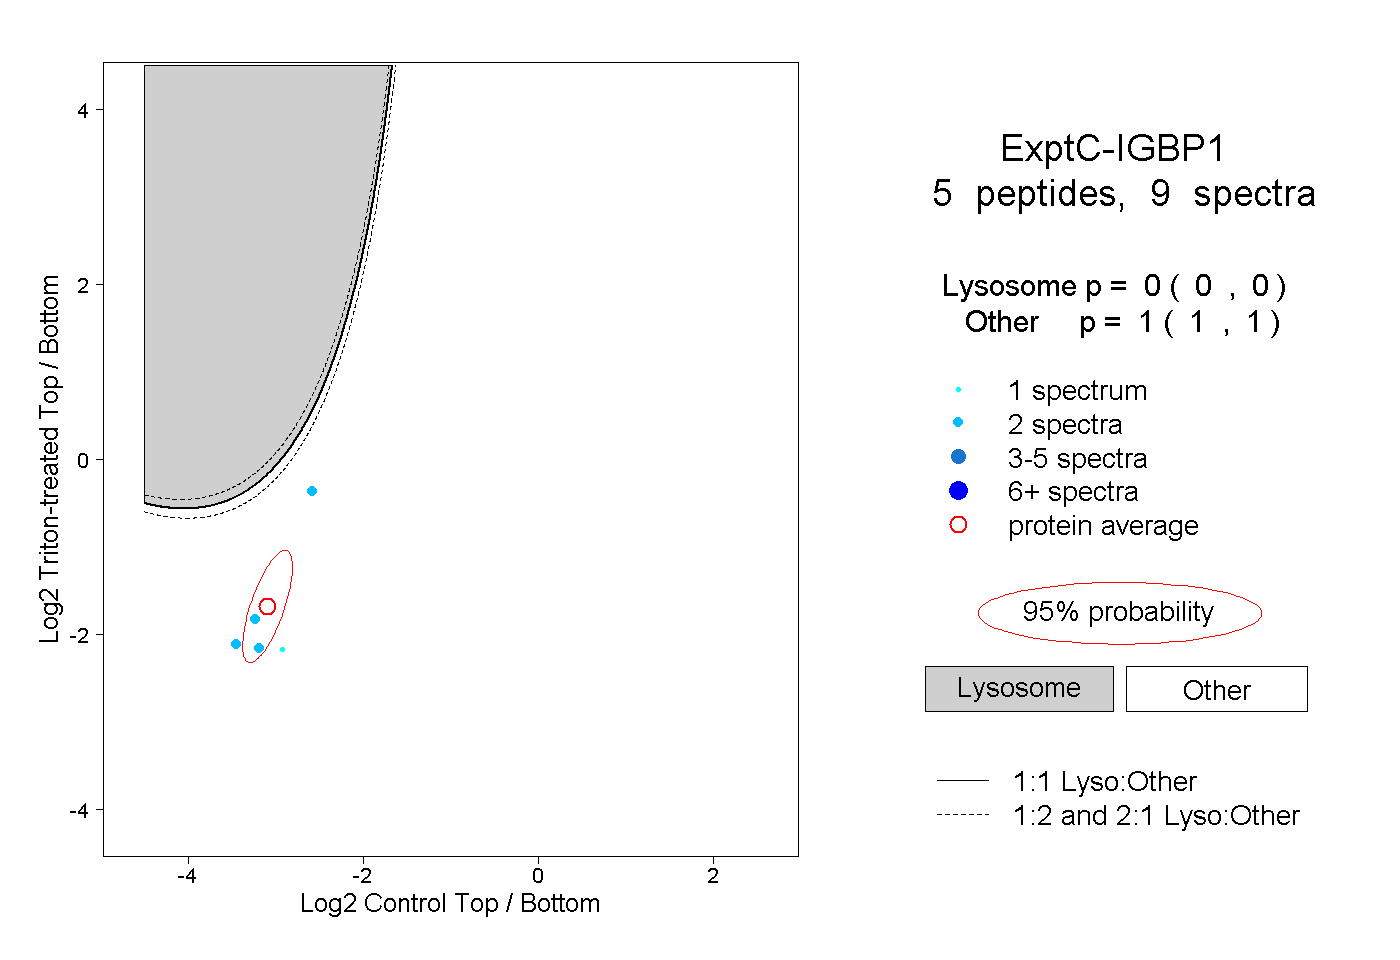
0.000 | 0.000
1.000 | 1.000
1peptide
spectrum
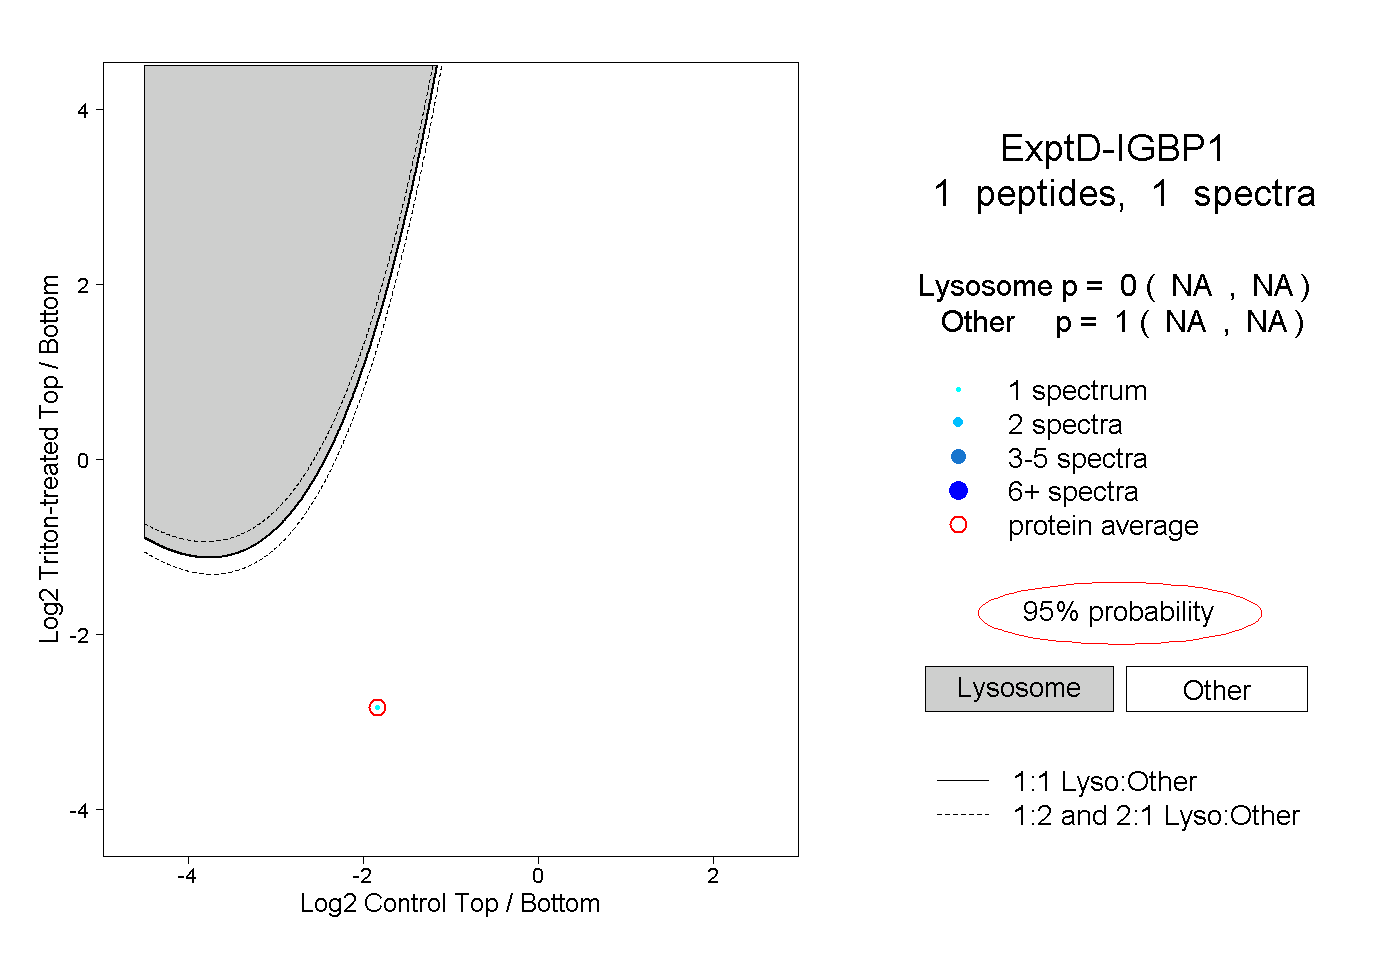
NA | NA
NA | NA