 1
1peptide
spectrum
NA | NA
NA | NA
NA | NA
NA | NA
NA | NA
NA | NA
NA | NA
NA | NA
2peptides
spectra
0.020 | 1.000
0.000 | 0.975
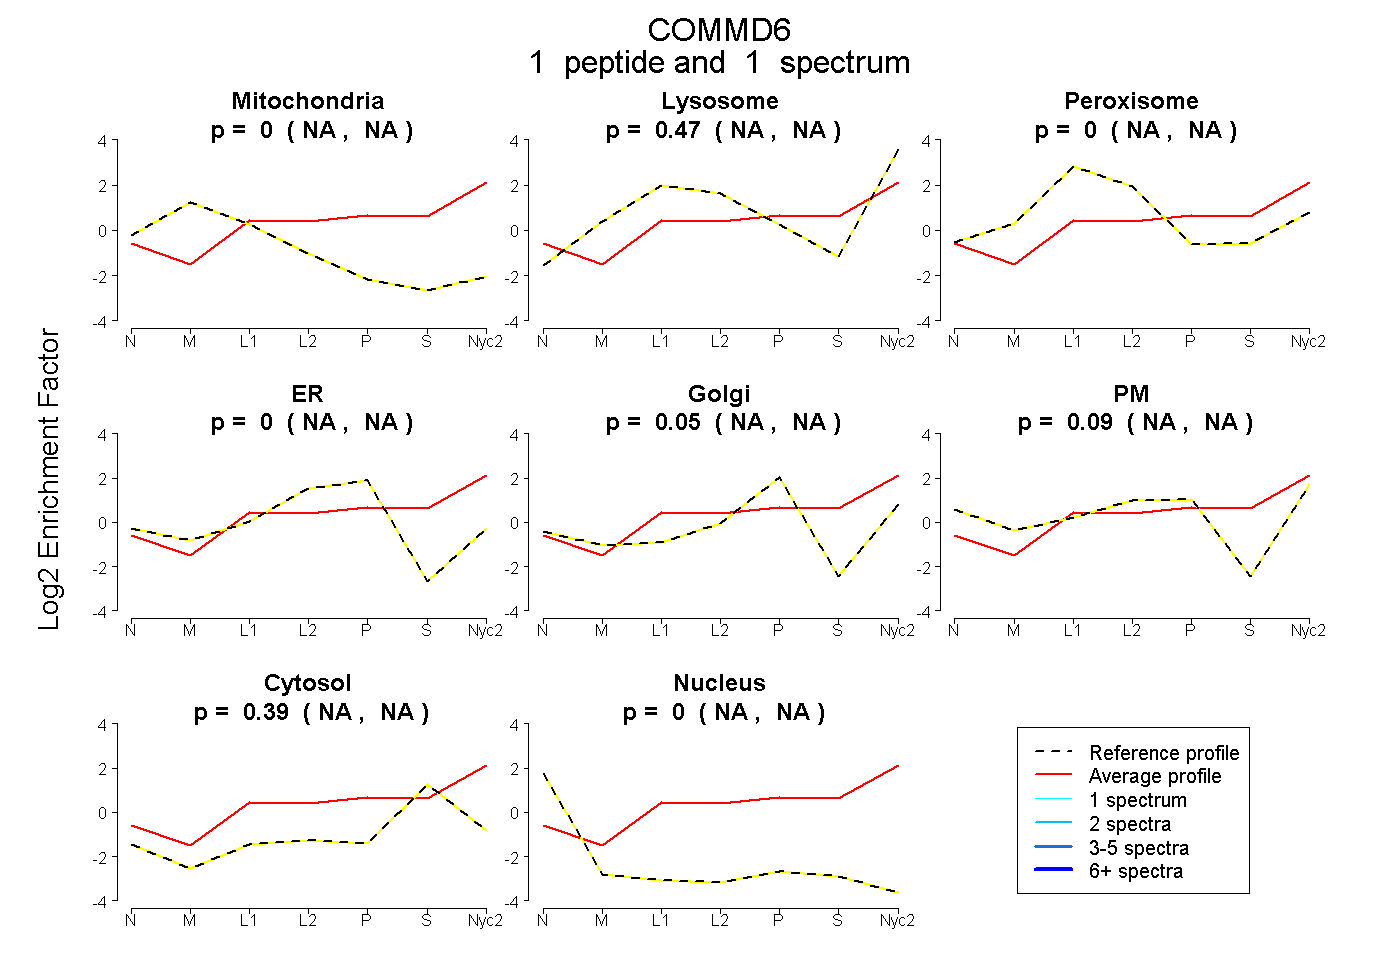
| Plot | Mito | Lyso | Perox | ER | Golgi | PM | Cytosol | Nucleus | |||||
| Expt A |
1 peptide |
1 spectrum |
|
0.000 NA | NA |
0.473 NA | NA |
0.000 NA | NA |
0.000 NA | NA |
0.050 NA | NA |
0.089 NA | NA |
0.389 NA | NA |
0.000 NA | NA |
||
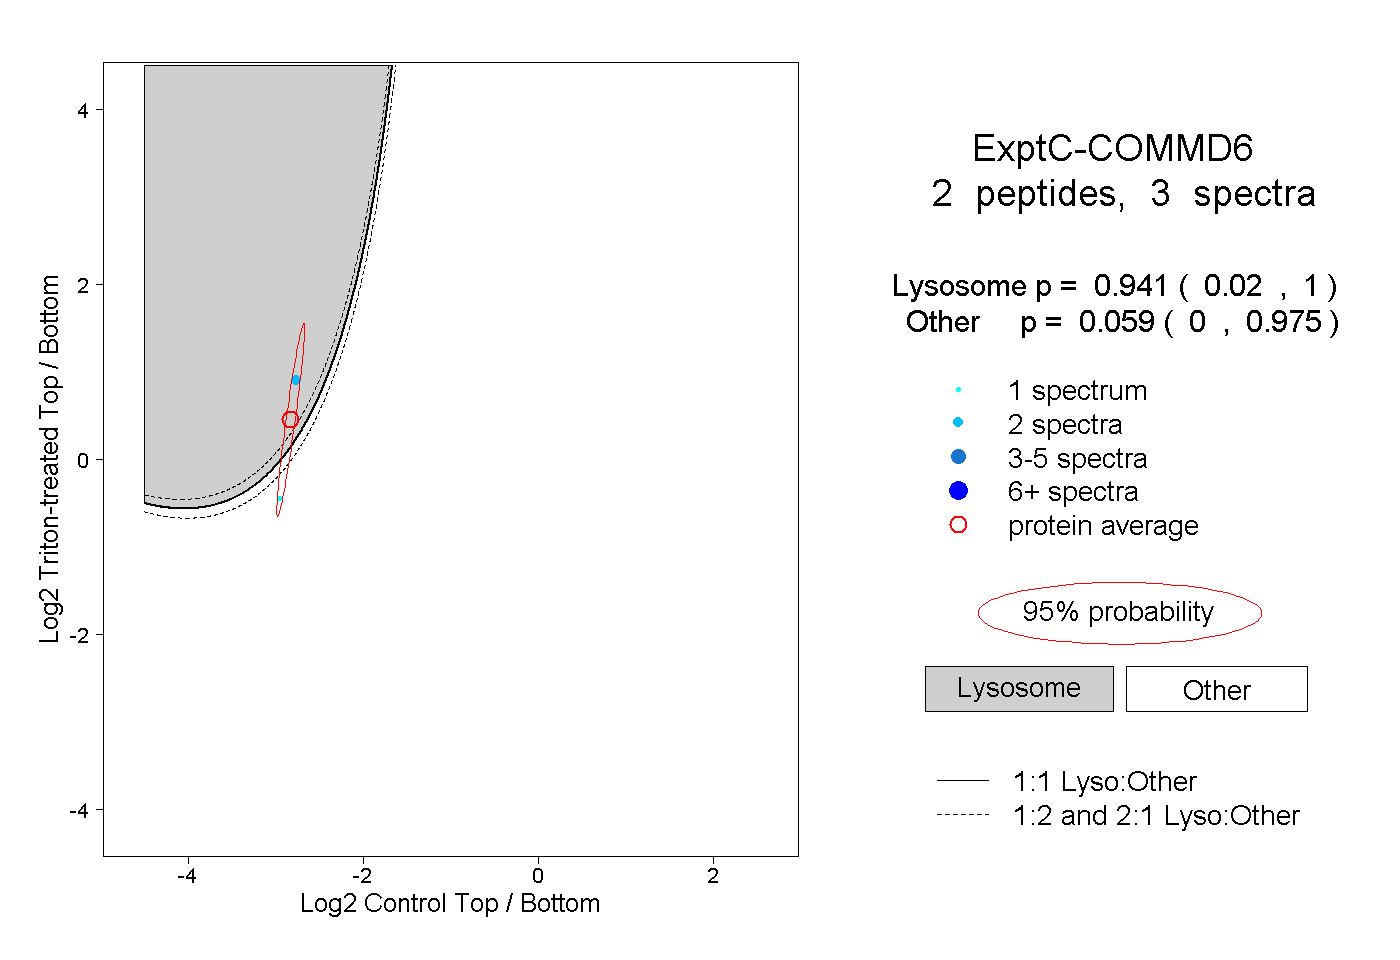
| Plot | Lyso | Other | |||||||||||
| Expt C |
2 peptides |
3 spectra |
|
0.941 0.020 | 1.000 |
0.059 0.000 | 0.975 |
| 2 spectra, EPVLDAK | 0.997 | 0.003 | ||||||||
| 1 spectrum, VADHSGQVSSK | 0.019 | 0.981 |