 3
3peptides
spectra
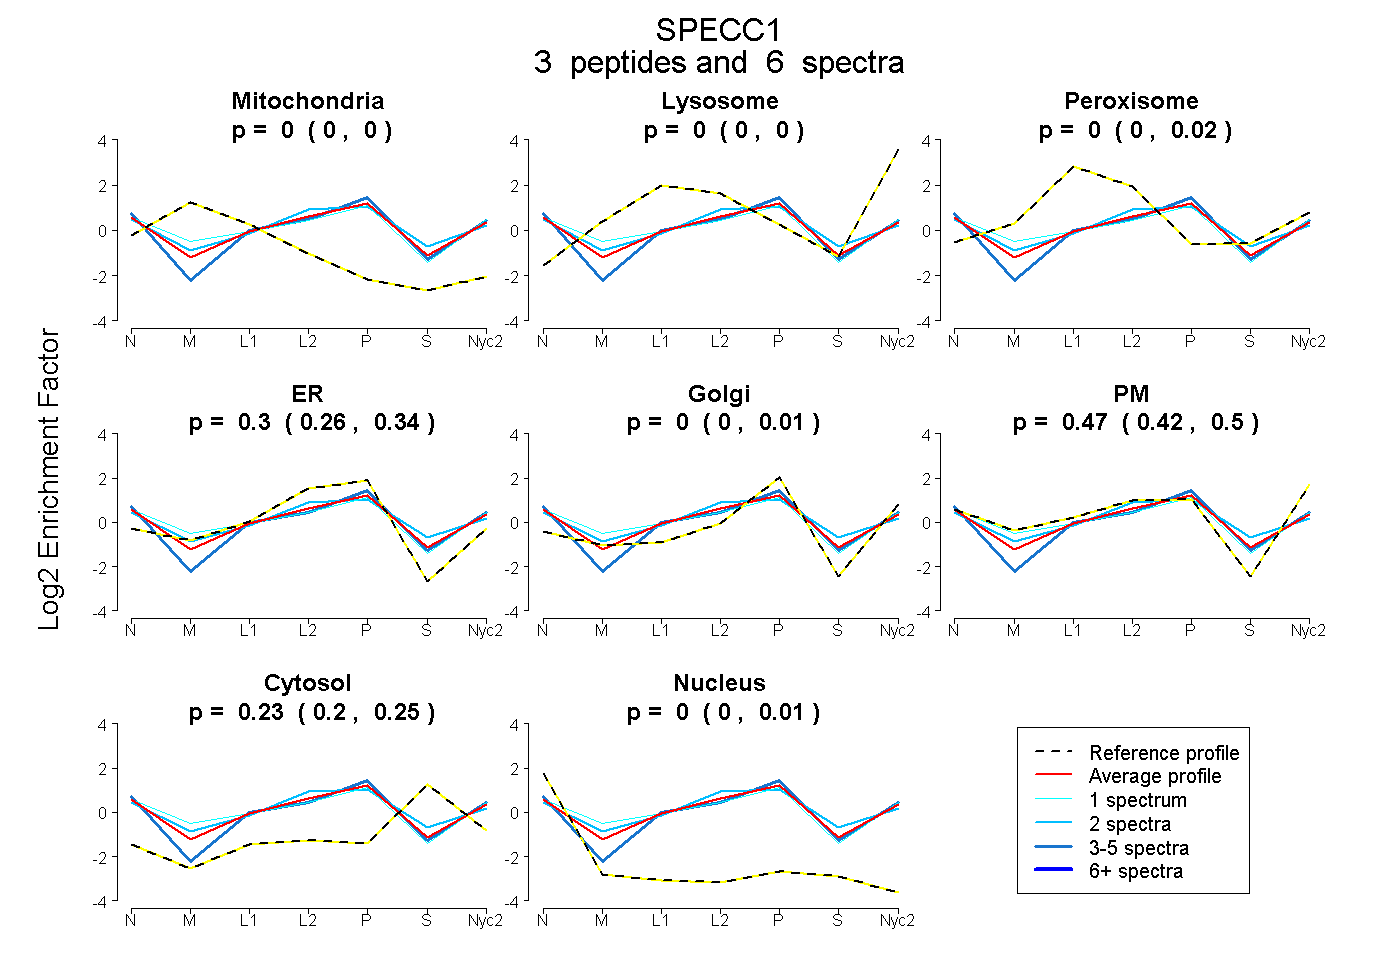
0.000 | 0.000
0.000 | 0.000
0.000 | 0.016
0.256 | 0.335
0.000 | 0.006
0.420 | 0.503
0.198 | 0.254
0.000 | 0.012
1peptide
spectra
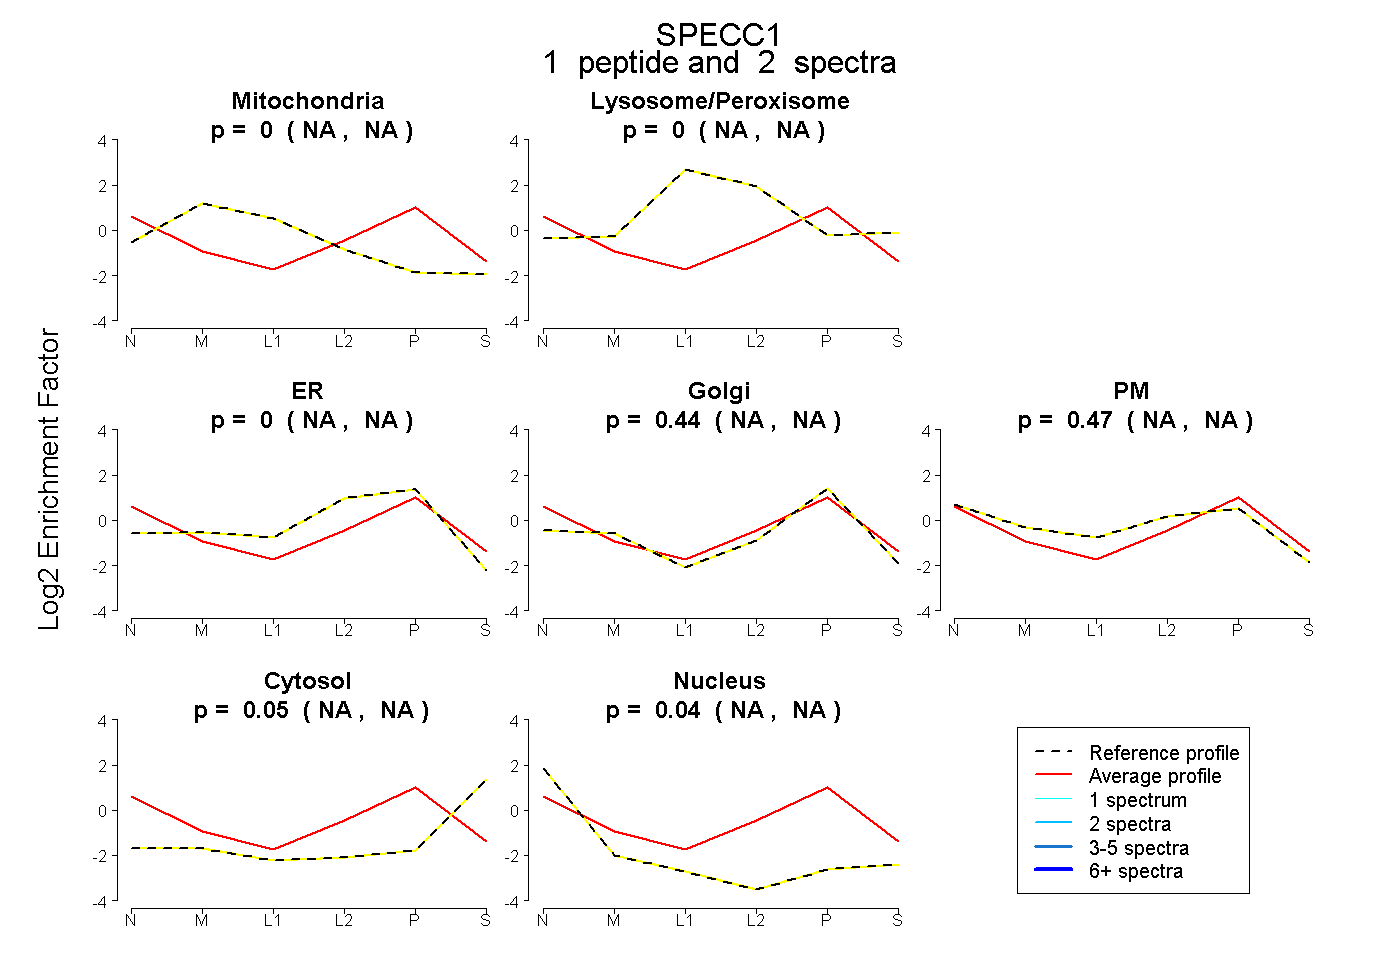
NA | NA
NA | NA
NA | NA
NA | NA
NA | NA
NA | NA
NA | NA
3peptides
spectra
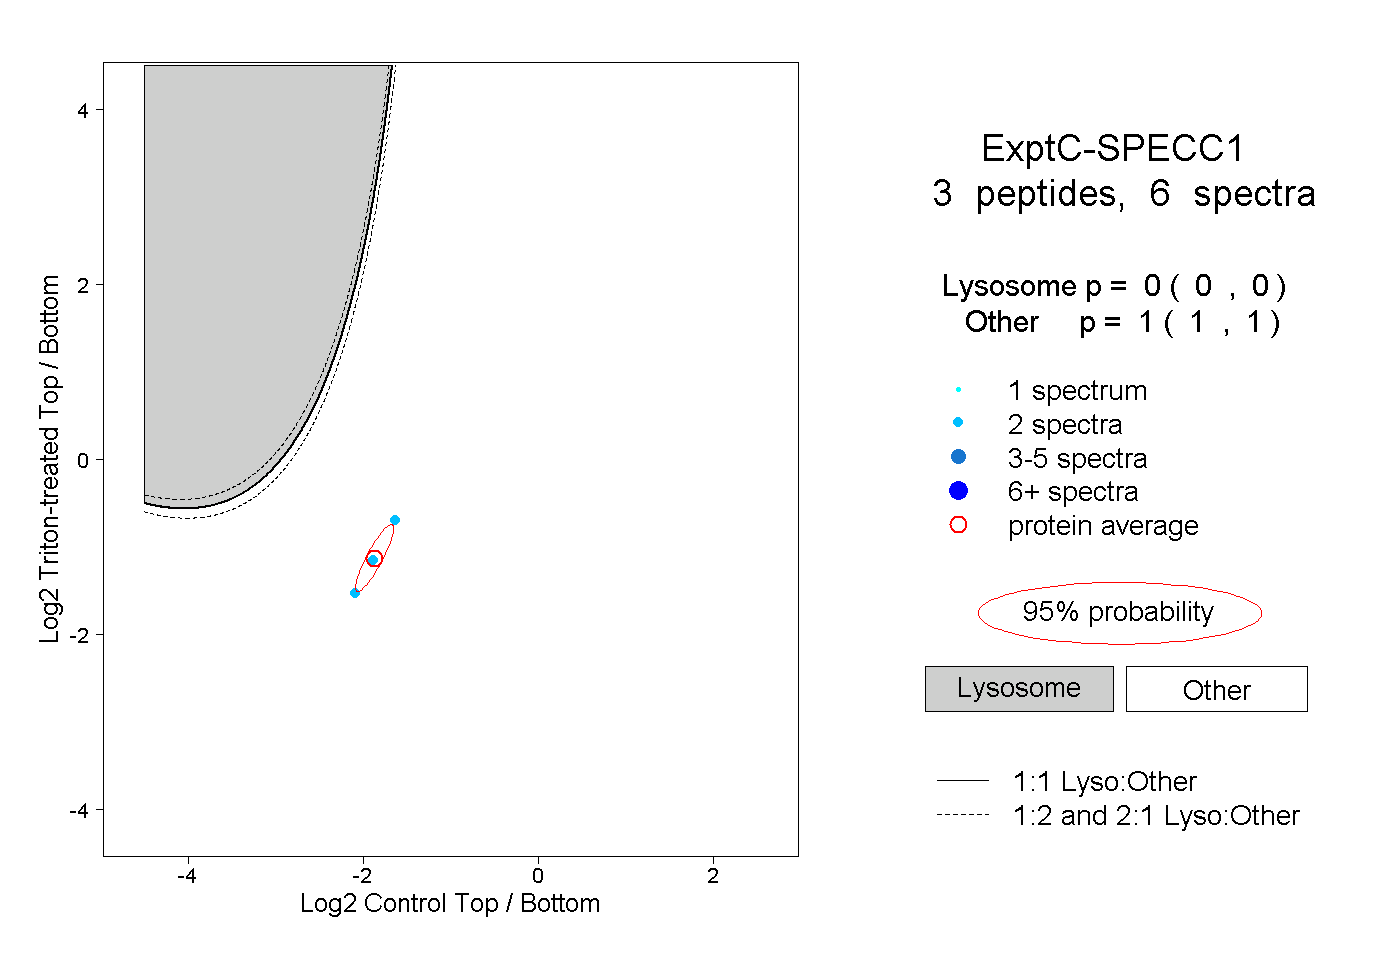
0.000 | 0.000
1.000 | 1.000
1peptide
spectrum
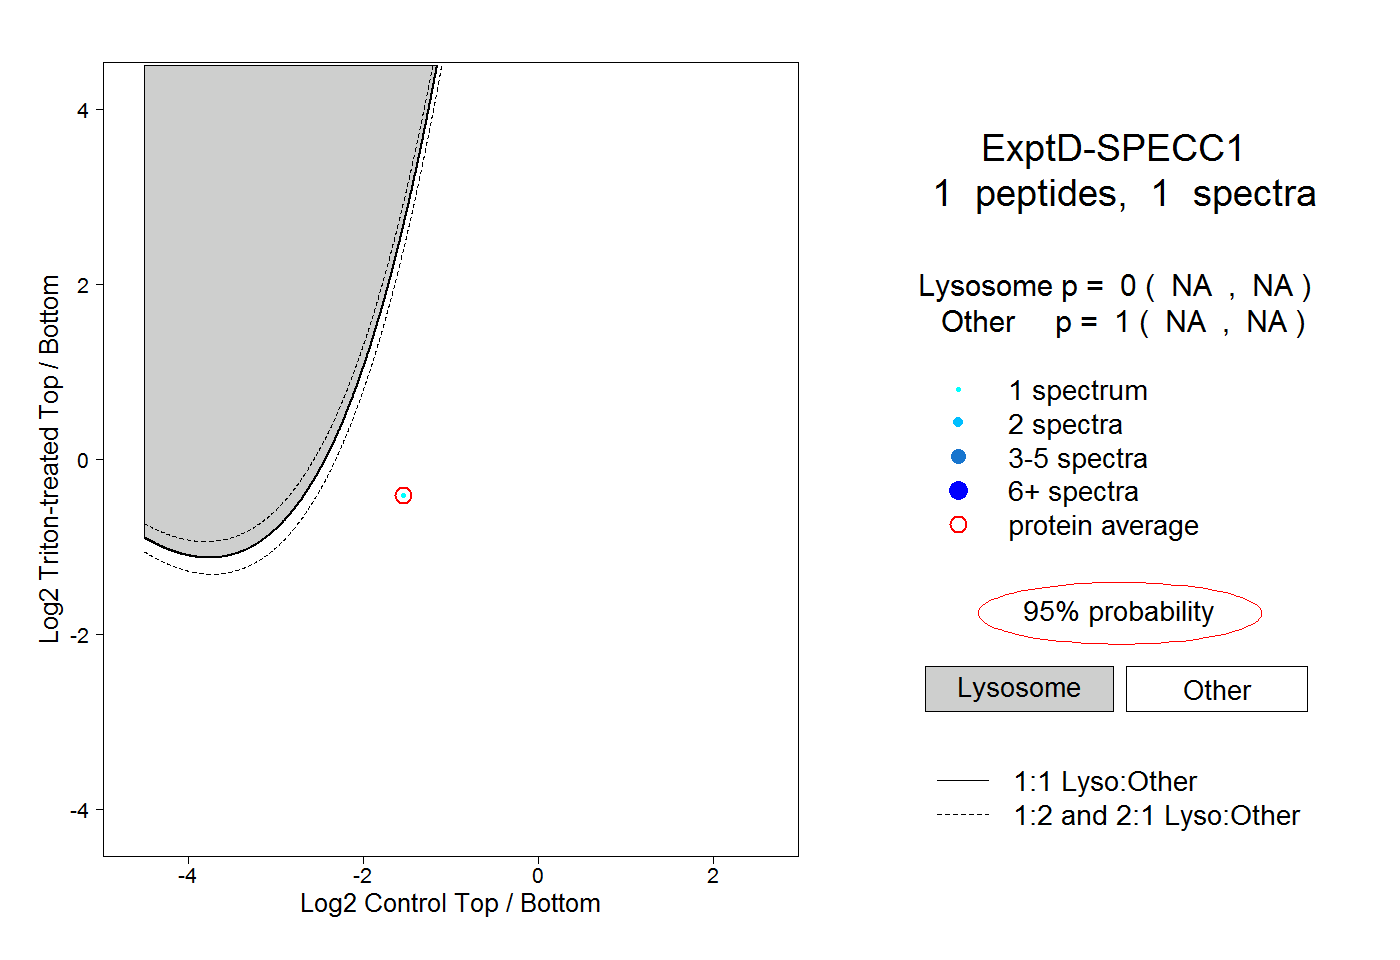
NA | NA
NA | NA