10
10peptides
spectra
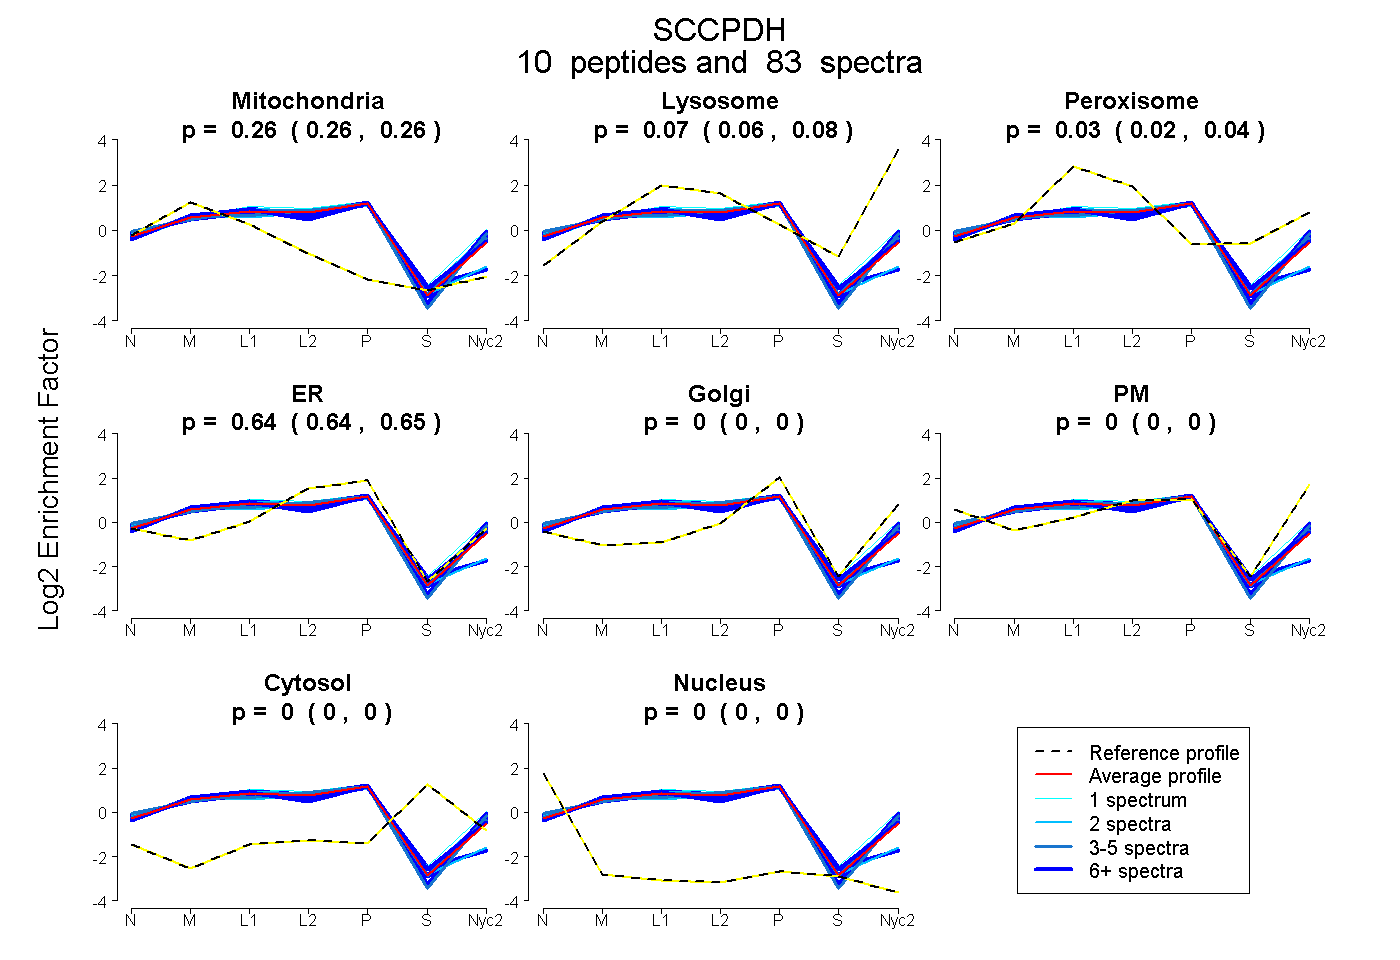
0.256 | 0.260
0.056 | 0.078
0.022 | 0.038
0.639 | 0.646
0.000 | 0.000
0.000 | 0.000
0.000 | 0.000
0.000 | 0.000
9peptides
spectra
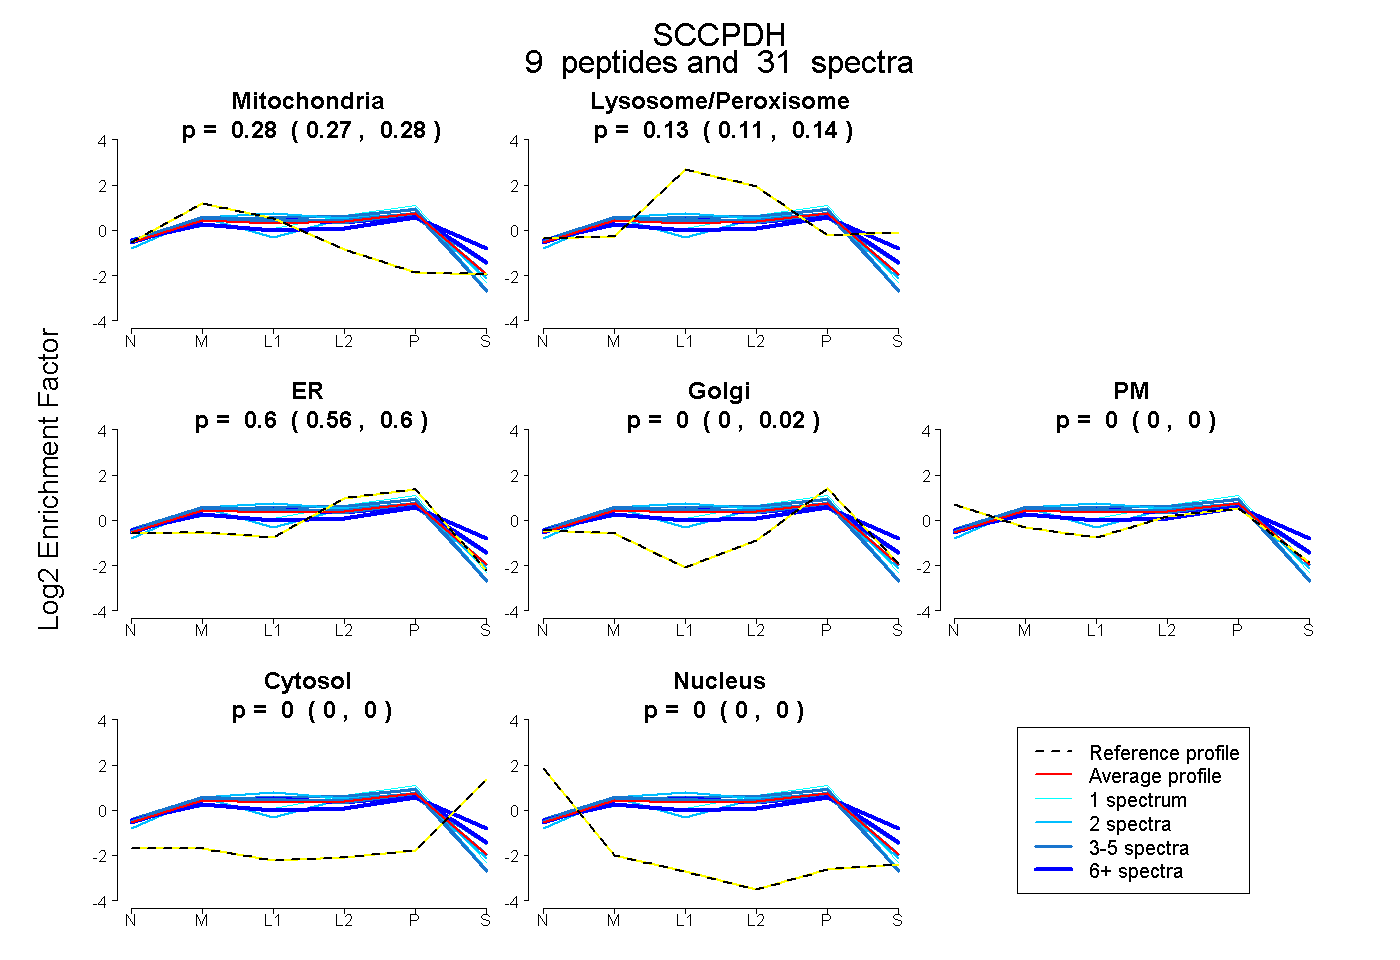
0.265 | 0.281
0.114 | 0.144
0.563 | 0.605
0.000 | 0.017
0.000 | 0.000
0.000 | 0.000
0.000 | 0.000